- English
- 中文版
.jpg?height=93&quality=100)
XAUUSD - New ATHs Keep Coming
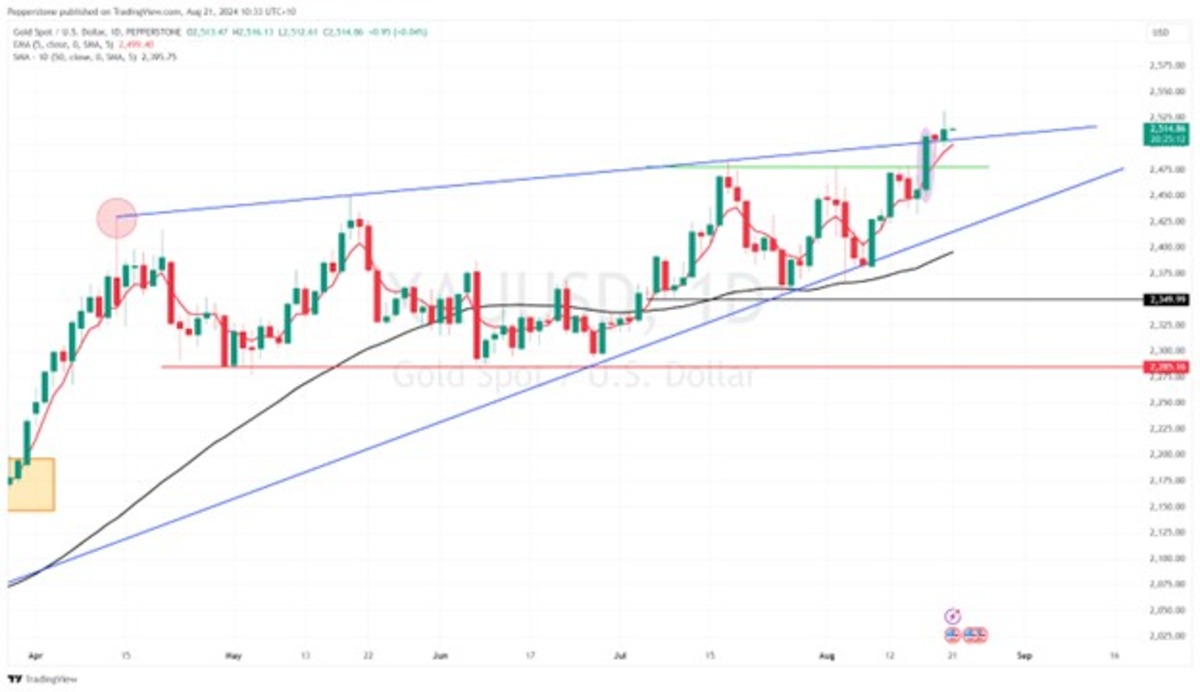
Since the bulls pushed gold past the $2500 mark last Friday, the momentum has slightly tapered off, but the price has continued to set new all-time highs. Currently, it’s lingering near the upper boundary of the rising wedges that have formed since mid-April.
Key fundamentals include the high probability of a 25bp Fed rate cut in September, increased geopolitical risk from the U.S. elections and Middle East tensions, and new gold import quotas for several Chinese banks, which could significantly boost local demand. While these factors are bullish for gold, they are already well priced in.
The initial surge was fueled by substantial inflows into gold ETFs and momentum-chasing CTA funds. Now that the price has reached a key psychological level, traders are looking for new catalysts to either confirm their bullish bets or reduce shorting costs.
Powell's speech at the Jackson Hole Symposium on Friday night is crucial. If he reinforces the consensus for a 25bp rate cut by the Fed in September, the reaction in gold might be limited. However, if he hints at the possibility of a 50bp cut, it could provide a fresh boost to gold bulls, with the price potentially testing $2550.
NAS100 - Bulls Took a Breather
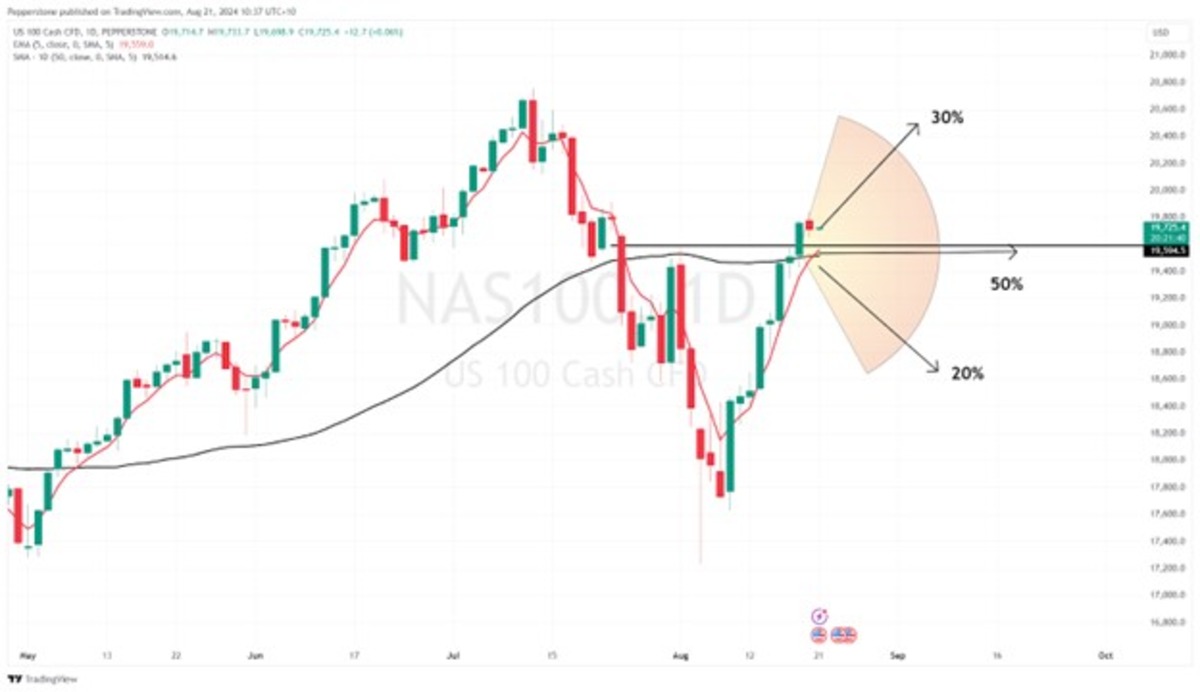
As of Monday, after a solid eight-day winning streak, the Nasdaq saw a 0.2% dip yesterday as shorts took their positions. Nvidia’s 2.1% pullback weighed on the index. Overall, this brief retreat by the bulls seems more like profit-taking rather than being driven by fundamental news, reflecting a cautious market sentiment.
With the U.S. labor market in focus, tomorrow at 10 AM AEDT, the BLS’s annual revision of nonfarm payrolls data is crucial. The forecast is for US job growth to be revised down by 600,000 to 1 million positions. If the numbers come in as expected, it could shake up risk-on sentiment and test the support around the August 1st highs and the 50-day moving average of 19,600 points.
On the flip side, if Nvidia’s earnings report on August 29 (AEDT), especially its guidance, comes in strong, the Nasdaq might bounce back and push toward the 20,000 mark.
HK50 - Flash in the Pan
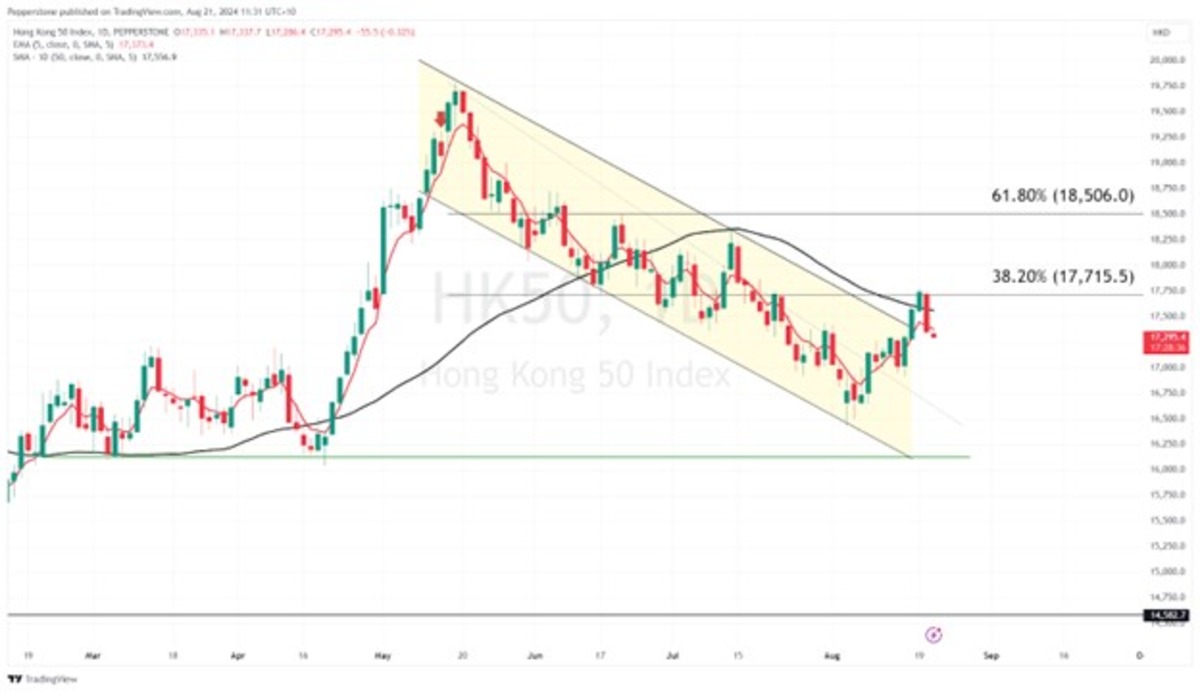
The HK50 bulls briefly broke through the downtrend line and 50-day moving average from mid-May earlier this week. However, just as traders anticipated the index would continue its upward momentum, selling pressure drove the price back to the upper edge of the trendline.
On the global front, improving risk sentiment has created favorable conditions for foreign capital to flow back into Hong Kong stocks. Domestically, strong earnings from Hong Kong’s tech sector and aggressive share buybacks by companies - surpassing last year’s total - are boosting shareholder returns and making the market more attractive to buyers.
However, given the ongoing recovery in China’s economic momentum, short-term bets on Hong Kong stock earnings may struggle to provide sustained upward momentum.
Key support levels to watch are the upper boundary of the downtrend and the August 5th low of 16,432. If China’s economic data shows improvement and bullish momentum persists, resistance levels to monitor are the 50-day moving average and 17,715, which also marks the 38.2% Fibonacci retracement of the downtrend from mid-April to early August.
USDJPY - Where’s the Floor?
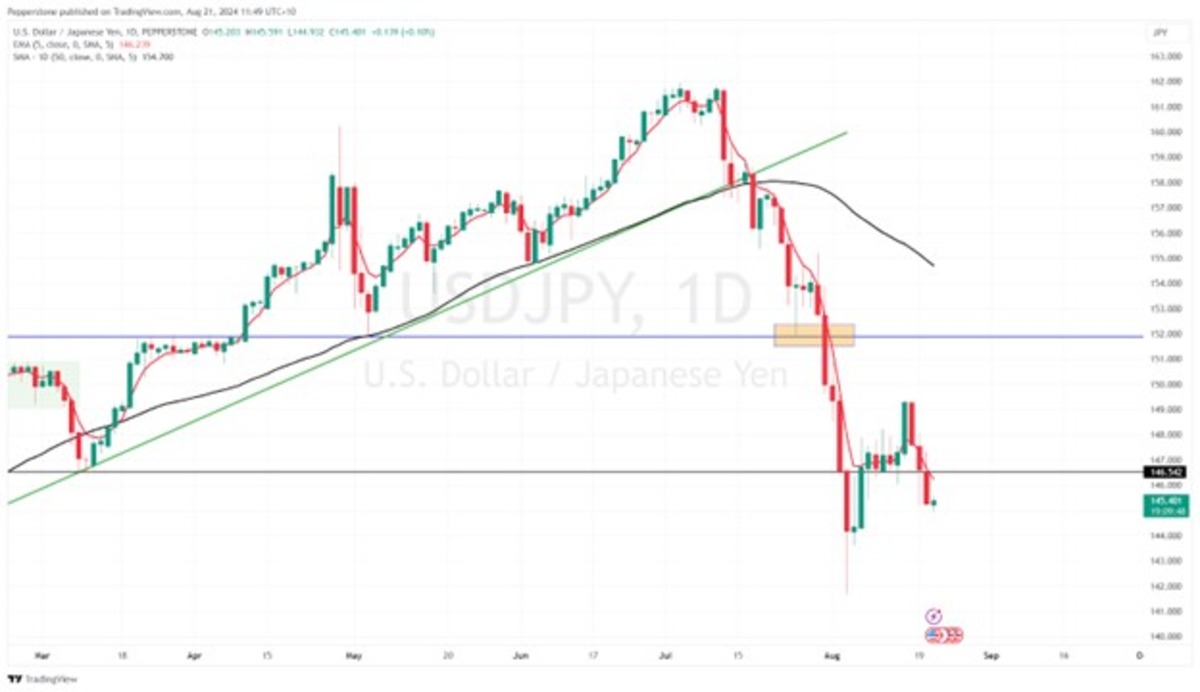
The USDJPY broke below the key support level of 146.5 in the last trading session, showing strong bearish momentum. I believe this is primarily due to the narrowing of the US-Japan yield spread.
US Treasuries saw good buying interest. With Canada’s latest core CPI growth cooling to 2.4% year-on-year, and a slowdown in the CPI median and trimmed index, confidence in rate easing has strengthened. This led to a drop in the 2-year US Treasury yield below 4%, while the 2-year US-Japan yield spread narrowed to 3.65%, a low for 2023. Coupled with a notable increase in risk appetite among traders, the US dollar has come under selling pressure.
Traders will closely monitor how the price reacts between 140.7 and 141.5, which has acted as resistance in May and July 2023, and support in December. Bank of Japan Governor Ueda Kazuo will speak on Friday, and with market volatility decreasing, he may comment on potential future rate hikes. Any hawkish remarks could lead to further declines in the exchange rate.
SpotCrude - How will prices react around $73?

Since mid-August, Spot Crude prices have been steadily retreating. This decline is driven by two main factors: Israel's agreement to a proposal resolving disputes that hindered a Gaza ceasefire, which has eased concerns about Middle Eastern supply disruptions, and weak economic data from China, which has dampened energy demand.
Prices are currently testing the lower edge of a triangular consolidation pattern that has been forming since late September 2023. A confirmation of a break below this level will make the reaction around the crucial support at $73 per barrel particularly significant.
Keep an eye on the EIA crude oil inventory report, set to be released at 0:30 AEDT tomorrow, and any related geopolitical developments. If the report shows a drop in US crude inventories and tensions in the Middle East escalate, Spot Crude could rebound to the 50-day moving average of $80 per barrel.
The material provided here has not been prepared in accordance with legal requirements designed to promote the independence of investment research and as such is considered to be a marketing communication. Whilst it is not subject to any prohibition on dealing ahead of the dissemination of investment research we will not seek to take any advantage before providing it to our clients.
Pepperstone doesn’t represent that the material provided here is accurate, current or complete, and therefore shouldn’t be relied upon as such. The information, whether from a third party or not, isn’t to be considered as a recommendation; or an offer to buy or sell; or the solicitation of an offer to buy or sell any security, financial product or instrument; or to participate in any particular trading strategy. It does not take into account readers’ financial situation or investment objectives. We advise any readers of this content to seek their own advice. Without the approval of Pepperstone, reproduction or redistribution of this information isn’t permitted.