- English
- 中文版
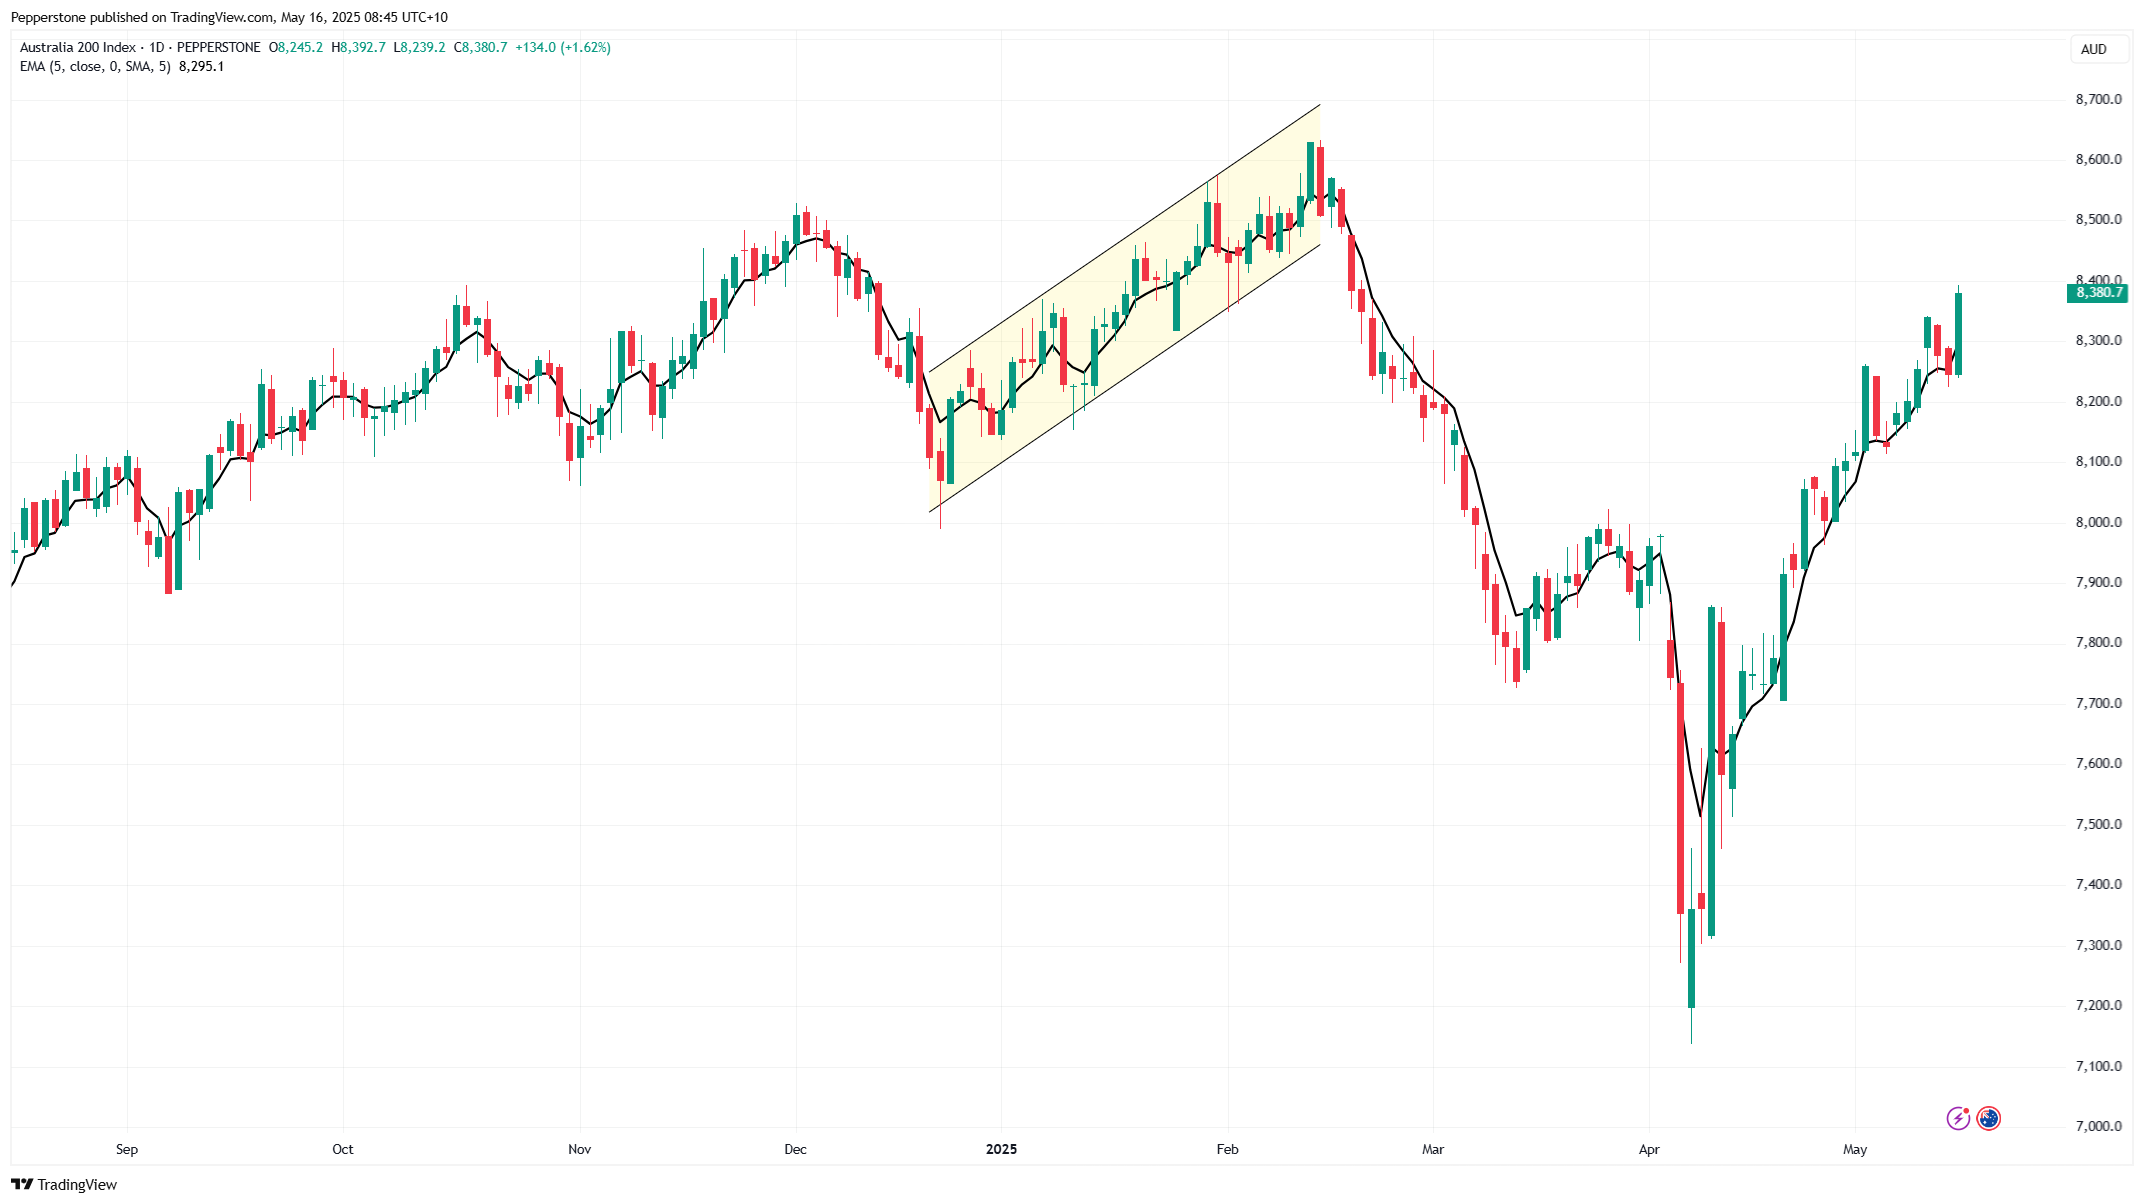
ASX200’s 8-Day Winning Streak: Momentum to Continue or Reversal Ahead?

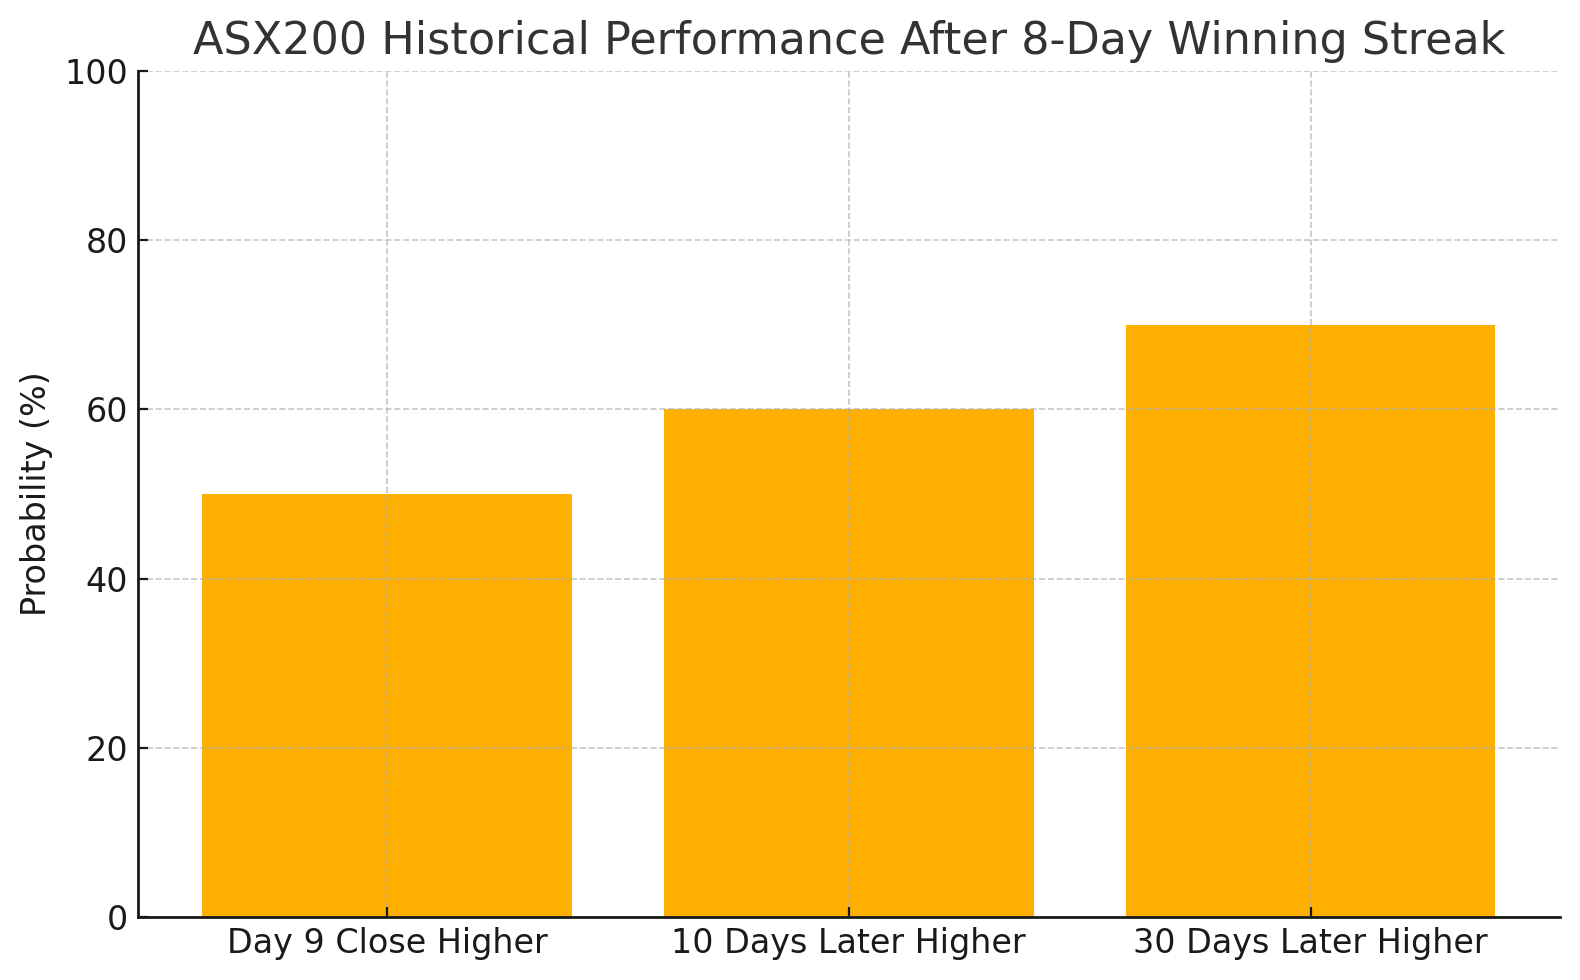
Well, that depends on the strategy and the timeframe the strategy works optimally in.... crunching the data since 2000, we find there have been 34 occurrences where the ASX200 has rallied for 8 consecutive days and in 50% of those occurrences the Aussie equity index goes on to close higher the next day for a 9th higher close.
We also see that the average gain on the 9th day has been +0.54%, while the average fall -0.3%. Even if we take the sample data to 2020, we see the ASX200 up 50% of the time.
Since 2000, if you bought the ASX200 on the 8th day of gains, 10 days later you'd be in the money with the index higher 60% of the time.
30 days later, the index was up from that point 70% of the time.
Past performance doesn’t offer any statistical edge to compel a trade when considering the winning streak in isolation. We can of course optimize and include new variables, such as adding technical indicators to assess the form with different overbought readings, or when the market internals (number of companies at 4-week highs, above the 50-day moving average etc) moved to extreme reads, or where the index is in relation to the 52-week or all-time highs etc.
However, if we keep things super simple, all things being equal, the fact that the ASX200 index has gained for 8 days should be seen as a bullish sign, with past performance offering no statistical edge to compel countertrend positions.
If anything, one can argue this run of form is a signal for momentum traders or swing traders looking to take new longs into weakness around big support levels. While this time could well be different, and the form guide of prior hot runs does suggest strength begets strength.
The material provided here has not been prepared in accordance with legal requirements designed to promote the independence of investment research and as such is considered to be a marketing communication. Whilst it is not subject to any prohibition on dealing ahead of the dissemination of investment research we will not seek to take any advantage before providing it to our clients.
Pepperstone doesn’t represent that the material provided here is accurate, current or complete, and therefore shouldn’t be relied upon as such. The information, whether from a third party or not, isn’t to be considered as a recommendation; or an offer to buy or sell; or the solicitation of an offer to buy or sell any security, financial product or instrument; or to participate in any particular trading strategy. It does not take into account readers’ financial situation or investment objectives. We advise any readers of this content to seek their own advice. Without the approval of Pepperstone, reproduction or redistribution of this information isn’t permitted.