- English
- 中文版
S&P500 Trading Outlook (June 23, 2025) – Direction Defined by 5,917–6,040 Range

The US500 index absorbs the news flow impressively with the index currently lower by just -0.3% and the NAS100 -0.5%. We’re even seeing modest selling in US Treasuries, which is supporting the USD. Broad market sentiment evidently hasn’t deteriorated significantly.
On the daily chart, the US500 index is finding support at 5,917—a level that defined the June’s lows. Index traders appear content to defend this support ahead of 5,900; where a close below would likely be the trigger for accelerated selling towards the 50-day moving average at 5,768 and the May 23 pivot low at 5,741.
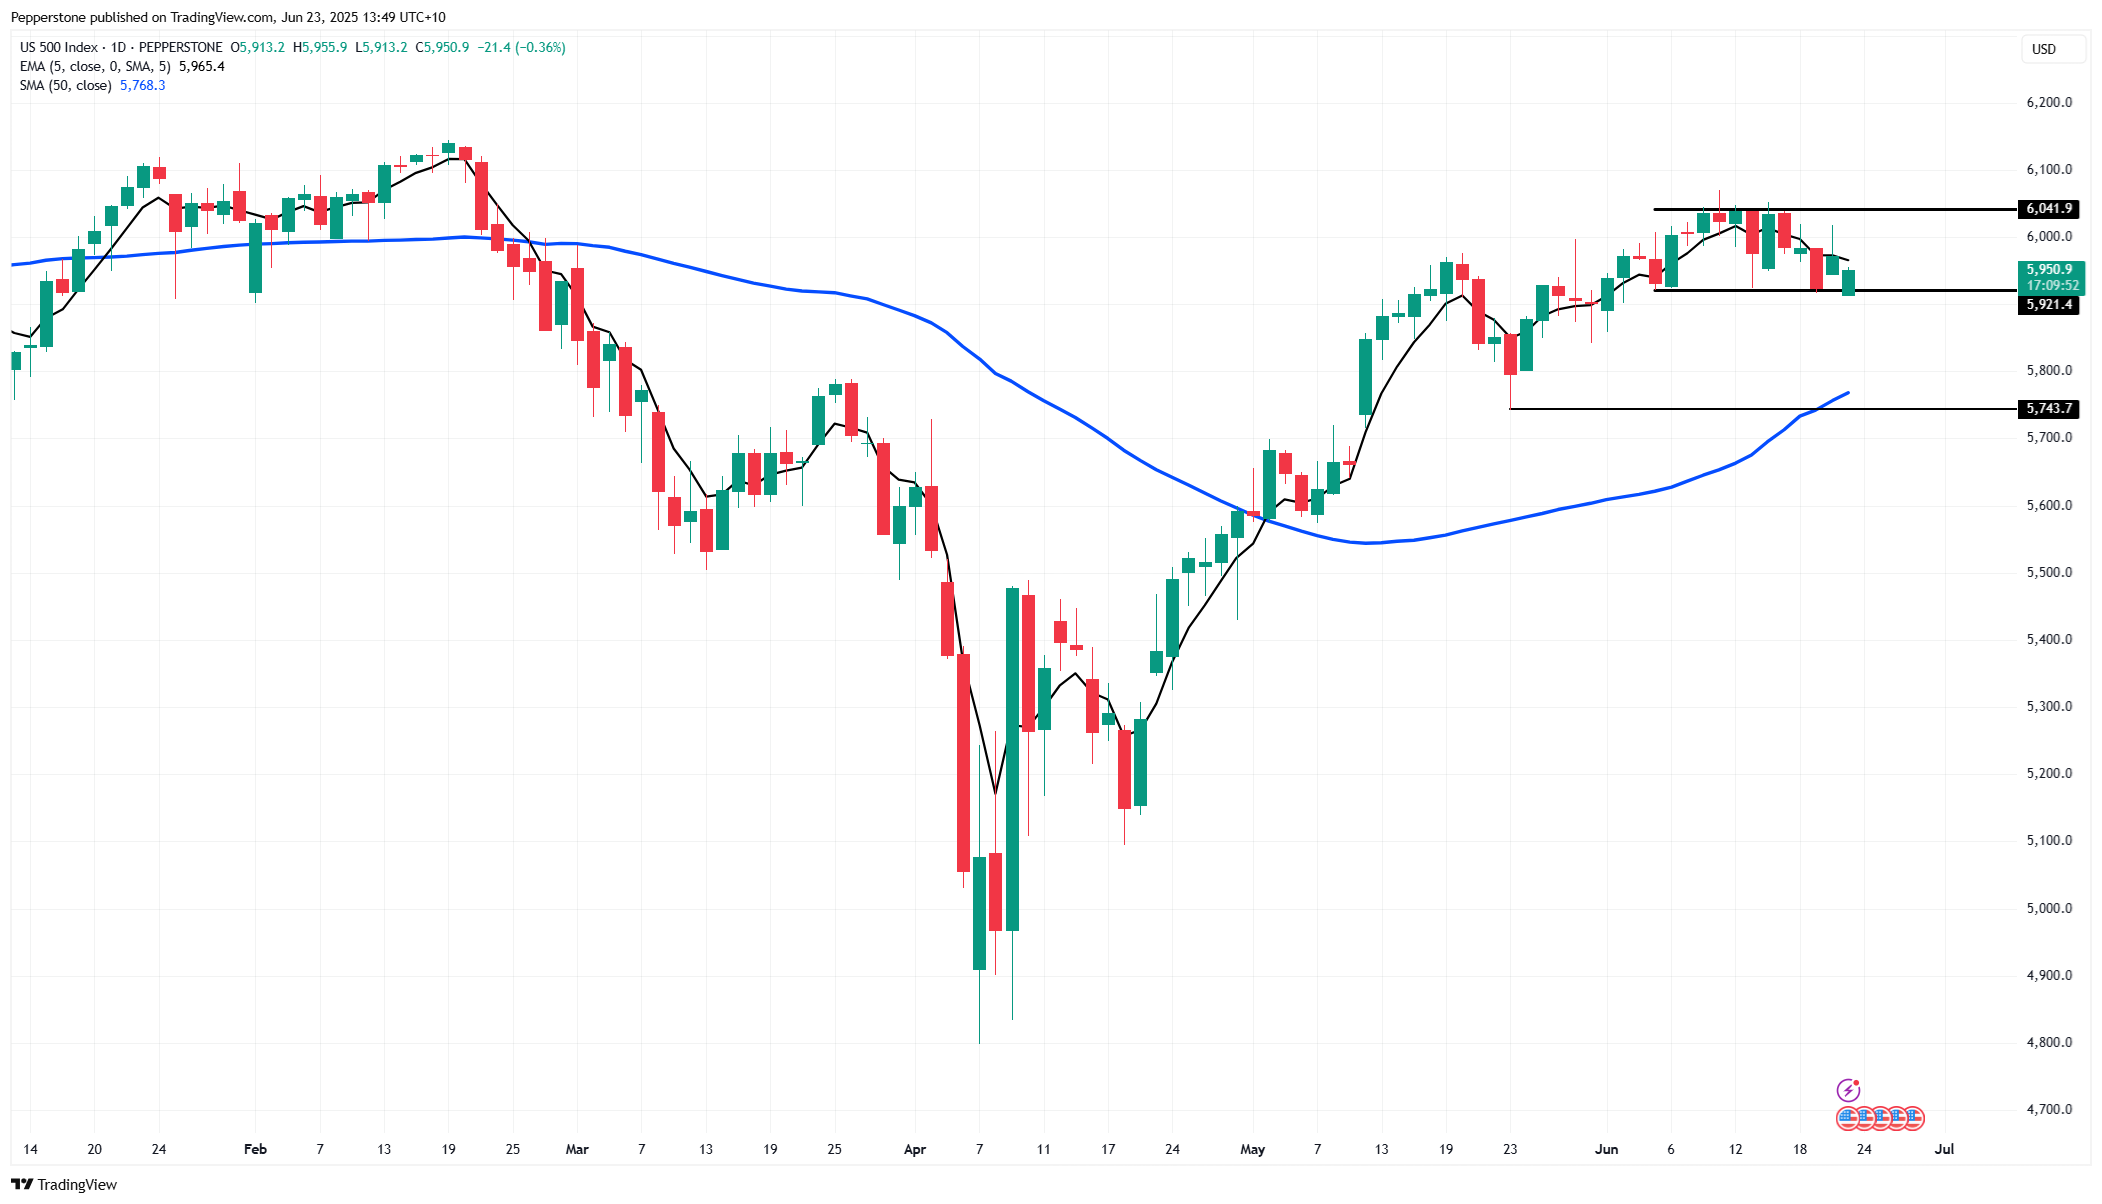
Those in long positions will be encouraged by the limited risk fallout so far in Asian trade but remain vigilant for higher volatility. A daily close above the 5-day EMA would be constructive and raise the odds of a rally toward the range top at 6,040. Only a daily close above 6,050 would signal the conviction needed for the US 500 to revisit its all-time high of 6,144.
For now, the US500 is defined by a 6,040 and 5,917 range, leaving the directional bias balanced and two-way. A breakout of either level could be meaningful, so maintaining a dynamic approach to the evolving price action is key.
Last week, the S&P 500 fell 1.3%, a move that was in line with most major global indices. Hedging activity did pick up and resulted in a modest rise in implied volatility with the VIX holding above 20%. Sector rotation has also been constructive in supporting the equity index: energy has significantly outperformed—unsurprising given the moves in Brent and WTI—while financials are outperforming by a wide margin, with JPMorgan and Bank of America looking attractive on the higher timeframes. Healthcare is the significant underperformer.
Sentiment remains buoyant among the mega-cap equity plays. Nvidia holds firm at $143.85 but is showing signs of fatigue, suggesting longs may soon cut back a touch. Google endured a sharper sell-off last week falling 5.2% w/w, but it wouldn’t surprise if the buyers supported a little lower at its 50-day MA, while Tesla and Apple remain resilient.
This week, attention shifts to a slate of Fed speakers, looming tariff deadlines, and the US fiscal debate as Congress aims to pass the “One Big Beautiful Bill” by July 4.
Key data include personal spending, durable goods orders, consumer confidence, and the core PCE inflation reading.
For now, market resilience in the face of US involvement in the conflict is impressive. History shows these events rarely derail earnings or sentiment, and crude would likely need to approach $100—and stay there for a prolonged period—to inflict material equity damage. The buy-the-dip crowd remains in control, but from a momentum perspective, US 500 longs need a daily close above 6,040–6,050 to gain confidence that a meaningful uptrend is underway.
The material provided here has not been prepared in accordance with legal requirements designed to promote the independence of investment research and as such is considered to be a marketing communication. Whilst it is not subject to any prohibition on dealing ahead of the dissemination of investment research we will not seek to take any advantage before providing it to our clients.
Pepperstone doesn’t represent that the material provided here is accurate, current or complete, and therefore shouldn’t be relied upon as such. The information, whether from a third party or not, isn’t to be considered as a recommendation; or an offer to buy or sell; or the solicitation of an offer to buy or sell any security, financial product or instrument; or to participate in any particular trading strategy. It does not take into account readers’ financial situation or investment objectives. We advise any readers of this content to seek their own advice. Without the approval of Pepperstone, reproduction or redistribution of this information isn’t permitted.