- English
- 中文版
.jpg?height=93&quality=100)
The central bank flame has been passed over the Atlantic back to the Fed. On Wednesday at 6pm GMT we will receive the Summary of Economic Projections and policy decisions from the Fed, followed by Jerome Powell’s press conference. My colleague Chris Weston has written a great preview here, so I won’t go into extensive detail, but rather touch briefly on what I think are the key issues to be aware of.
Given the market is pricing in almost 3 rate hikes through 2023, the Fed Funds rate (dot plots) projections will be in the spotlight. Do we see a shift in the median figure to a 25 bps hike - there would need to be an additional 4 Fed members vote in favour to see this happen. My view, similar to Chris’, is that we don’t. It would be inconsistent with the lower for longer message we've been hearing recently. I think the market is largely expecting this, with a low probability of a hawkish surprise (25 bps 2023 median Fed Funds rate). If we got a rise in the dot plot, bonds would most likely sell-off more, the dollar would be bid and gold put on offer. Interestingly, Citi Bank and JPM sees the median 2023 dot rising to one hike.
In terms of the economic projections, I’m expecting a substantial rise in 2021 GDP from December’s 4.2% median on the back of an accelerated vaccine rollout and the passing of the $1.9 trillion stimulus bill with the potential addition of an infrastructure bill. The Fed may want to be more conservative with their revision to GDP growth, however, I think we could easily see north of 5.5% US GDP growth for 2021 – it will be interesting to see how optimistic the Fed are feeling. The unemployment picture will be improved and hence projections revised down with inflation getting a modest push higher, but nothing substantial enough to induce an inflation scare. Although, I think if everything goes to plan we could begin to hear chatter about tapering in H2 2021, at this meeting Powell will reiterate that any discussion of tapering is premature. Financial conditions remain at multi-year lows as shown in the below chart, which will keep Powell sanguine about the rise in longer-term yields. Lastly, one topic which has the potential to cause some fireworks in bond land, is the extension or lack thereof of the treasury exemption in the Supplementary Leverage Ratio (SLR) which expires at the end of this month. A failure to extend this would cause financial institutions to liquidate their US Treasury exposure, which would give the green light to bond bears to take yields higher. It’s become quite political with senior Democrat politicians calling for no extension, but one suspects the Fed will push for some sort of extension - between 6-12 months.

Source: Goldman Sachs
This week’s meeting could be a large catalyst for movement in the greenback. Price action looks to be trying to reclaim the 92 level. There is horizontal resistance indicated by the white dotted line and the underside of the lower trend line of the ascending channel. The RSI has bounced off the 55 level and still has plenty room to run before it becomes overbought. The 21-day EMA and 50-day SMA provide dynamic support on the downside around 91.2 and 90.7 respectively. To the upside price targets would be 92, 92.5 and then 92.8 around the 200-day SMA. In the last eight FOMC meetings, movement of the dollar in the 60 minutes after the FOMC has been mixed, rallying 50% of the time with an average gain of 0.2%
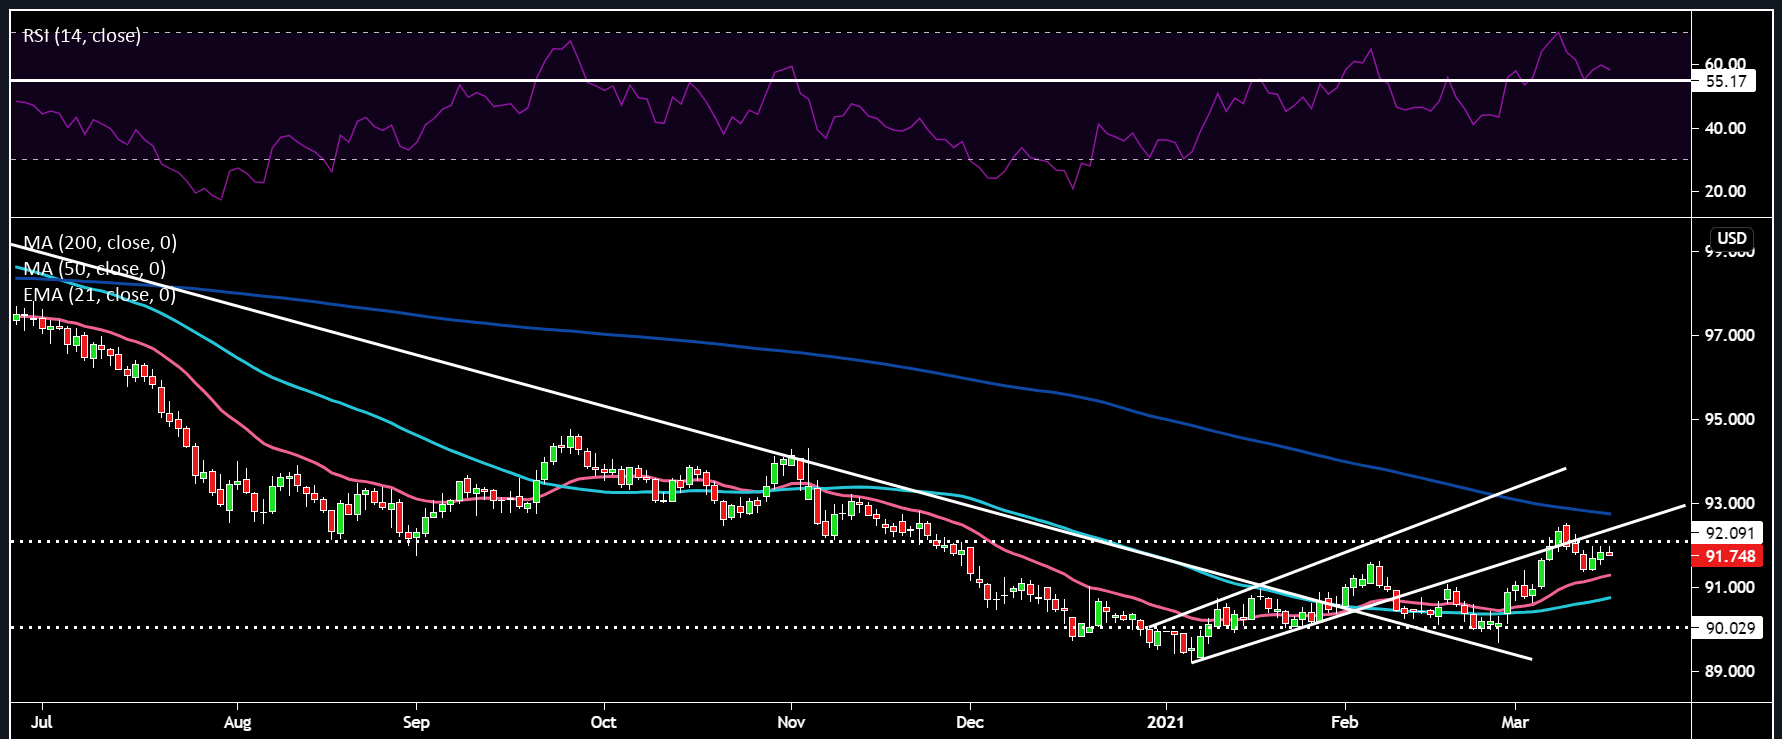
Pink line: 21-day EMA, Light Blue Line: 50-day SMA, Dark Blue Line: 200-day SMA (same for other charts)
The next major central bank meeting will take place in Japan on Friday at 3am GMT. This meeting is important as we will receive the results of the BoJ’s policy review it has undertaken in order to examine how to make its policies more sustainable. The key topics to be analysed are 1) potential adjustment to the 20 bps band around the 0% 10-year yield target on JGBs 2) flexibility in its ETF CFD purchases 3) how to cut rates further into negative without harming banking profitability.
On the first topic, BoJ officials are clearly trying to bring some price discovery back into a dormant Japanese bond market by allowing yields to fluctuate more normally. The challenge for the BoJ lies in trying to communicate to the market that it wants yields to move more freely, but not rise sharply so as to tighten financial conditions and handbrake Japan’s economic recovery. I’m sure Governor Kuroda will have seen how yields reacted when the Fed Chair was ambivalent with regards to the recent rise in yields and will not want a similar occurrence with Japanese Bonds. I would be shocked if the band was widened, given Japan isn’t doing great on the virus front and needs a strong economic recovery unimpeded by higher borrowing costs. Kuroda has pledged to keep the entire yield curve low and an expansion in the band could steepen the yield curve.
The BoJ’s ETF CFD purchase programme has led to it becoming the largest holder of Japanese Share CFDs, stealing the title away from the Government Pension Investment Fund. With the Nikkei at multi-decade highs, pressure is mounting on the BoJ to indicate why it’s necessary to continue supporting equity prices. I see an announcement of a more flexible equity purchasing programme as being more likely, so that they have more ammunition for much larger corrections that could occur. This links back to the whole purpose of this review – “sustainability”. An elimination of its 6 trillion yen annual target or its 12 trillion yen ceiling could be replaced by a more flexible approach which will be more reactive to specific market conditions. This may be too much to expect, although optimism is rising, Japan still faces many challenges and Kuroda knows maintaining easy financial conditions is essential.
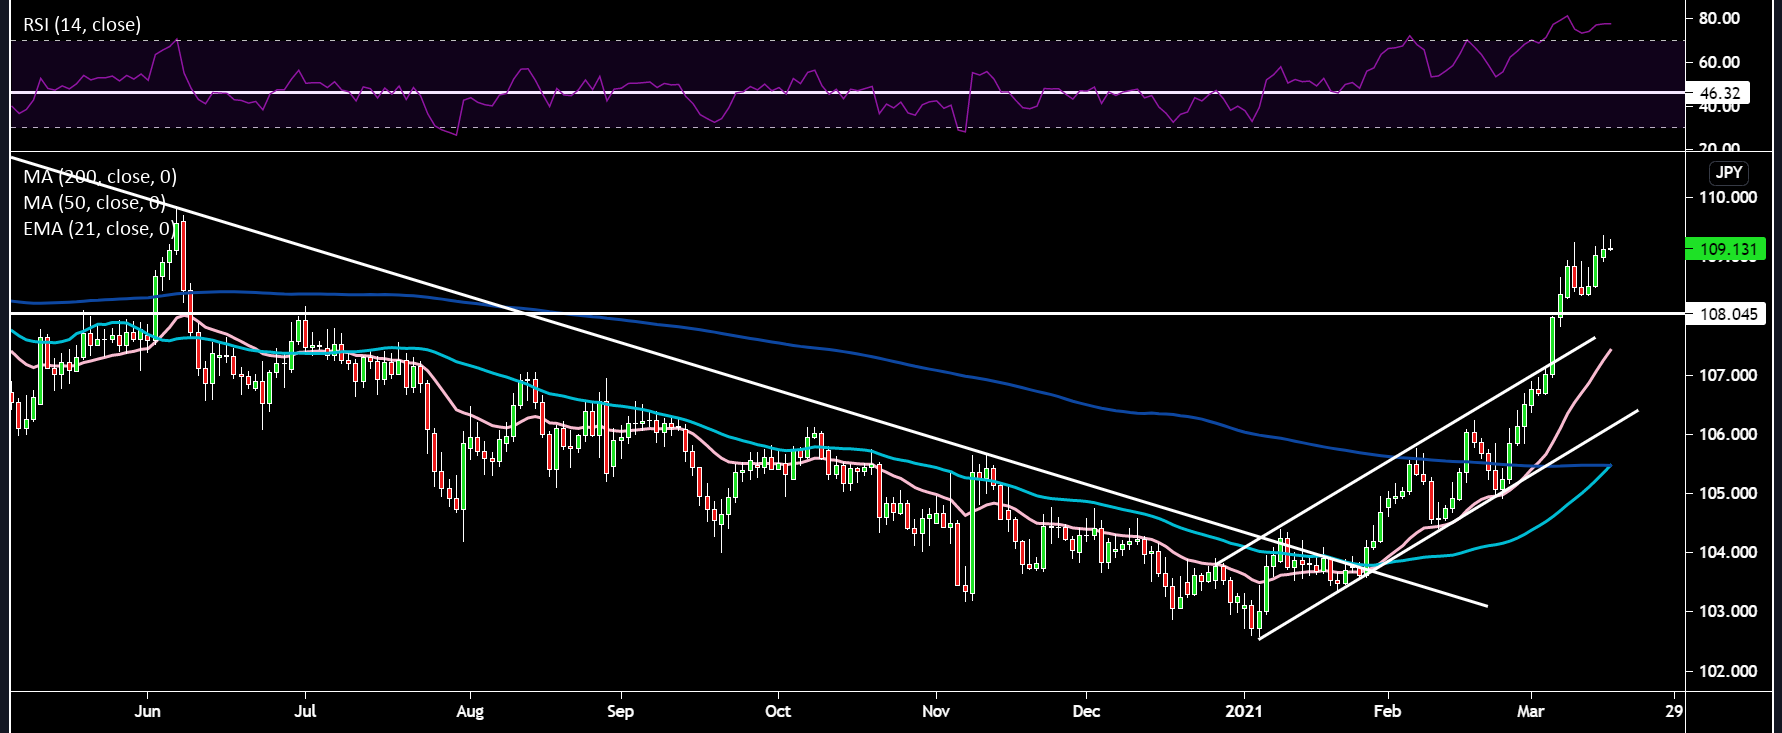
Negative rates squeeze banks’ profits via their net interest margins and the view is ,therefore, because of this rates can’t go lower. They could try to offset the side effects of negative rates by increasing the amount of reserves at the BoJ earning positive interest rates. USDJPY remains one of the most sensitive instruments to yield changes. Looking at the economic prospects stateside and in Japan as well as the hawkish Fed vs dovish BoJ it seems likely yield differentials will continue to widen, pulling the USDJPY up. This cross has rallied strongly already (RSI deeply overbought and price stretched far above moving averages), so any longs need to be patient to try buy into weakness. The 108 former resistance could now act as support for buyers to step in. It also looks like the 50-day SMA is crossing above the 200-day SMA and making the famous golden cross (typically medium-term bullish). To the upside 110 would be a good price target with 112 (March highs) potentially coming into reach on further strength.
Moving onto the UK we have the BoE’s interim meeting this Thursday at 12pm GMT. I expect the MPC to keep its policy rate at 0.10% and its asset purchase target at £895 bn. In February, the BoE revealed their economic forecasts which I’d say painted a picture of cautious optimism. I see little reason for this outlook to change - if anything the bank may have become more optimistic since then given the extra support from the budget and almost 40% of the UK adult population has been vaccinated. Could we see an adjustment to the expected £150 bn pounds of QE expected to take place this year on a robust reopening and surge in spending? In an interview yesterday, Governor Bailey stated he believes the economy will be back to pre-pandemic levels by the end of this year with a lower peak in unemployment and a pickup in inflation towards 2%. These conditions would strongly suggest that negative rates not being implemented are all but a certainty. Looking at the Sonia swap curve, the market is now pricing around 50 bps of hikes from the BoE over the next 3 years. Bailey did touch on the topic of negative rates in his interview yesterday, but it wasn’t anything we haven’t heard before – “Not out of tools for monetary policy, could introduce new tools”. They are asking banks to get ready for negative interest rates, but he stated "that's not a view on whether we will use them or not".
They key focus point for traders at this BoE meeting, will be how comfortable the BoE feels about the circa 50 bps rise in 10 year Gilts from early January. I don’t think they will lean against the rise in yields too much, instead taking a more balanced view as to the market pricing in a more optimistic economic outlook rather than a tightening in financial conditions. Governor Andrew Bailey has said as much, stating the lift in yields reflects the market’s view that the UK economy is on the path to recovery.
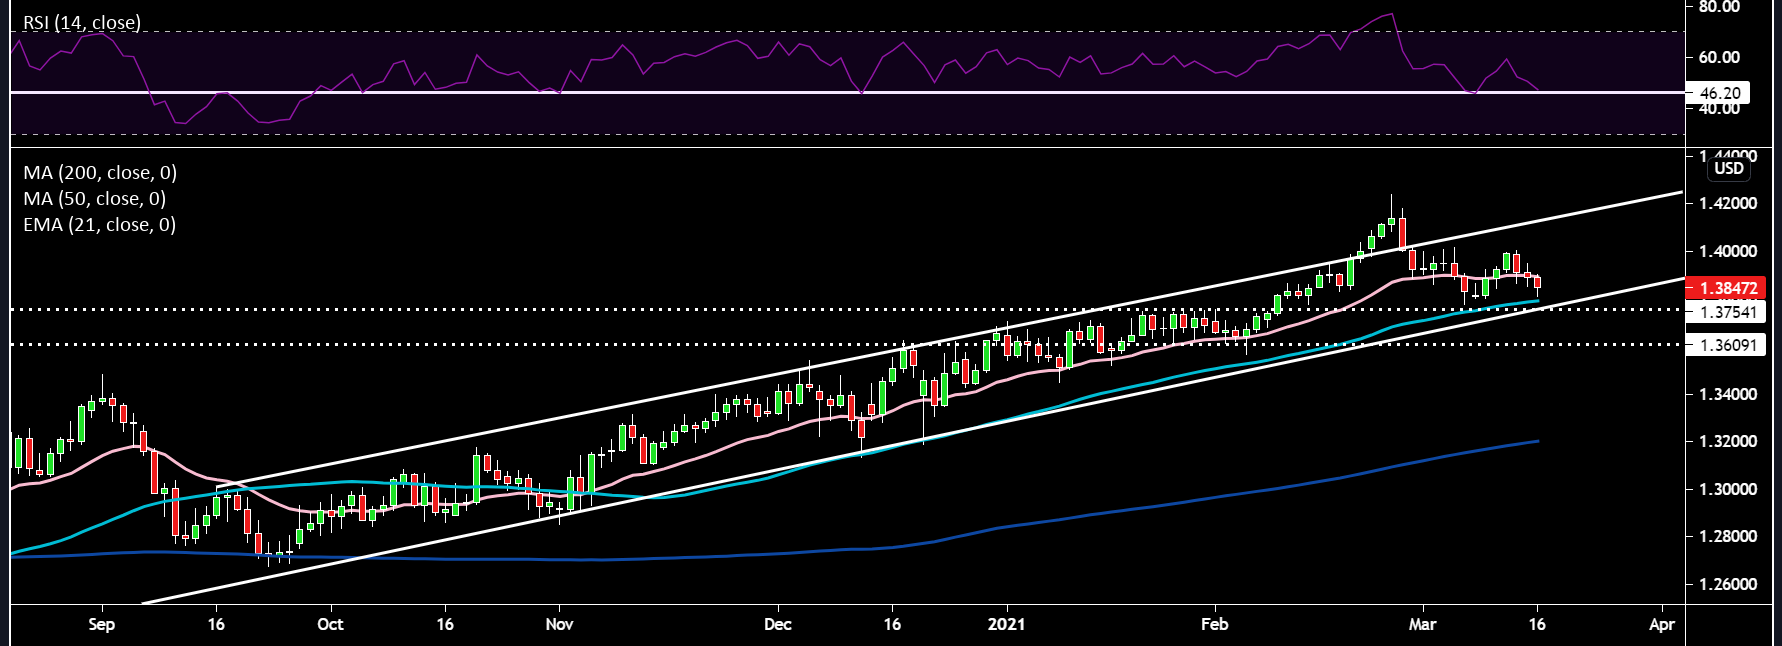
GBPUSD is weaker this morning and EURGBP had a large bullish candle. I feel like this isn’t down to any fundamental news flow as the legal case over the NI Protocol was well known yesterday and there was no reaction. Cable moved lower this morning to around 1.38 almost tagging the 50-day SMA. There is a ton of support around the 1.375-1.38 zone – lower trend line of the ascending channel, horizontal support and the 50-day SMA. The RSI is hovering right on the 45 support level which we could see a brief dip below if price moves lower, but this could just be a fake out. This cross continues to be a good candidate for a buy the dips approach in my opinion, using the support levels mentioned above as potential entry points.
Related articles


Ready to trade?
It's quick and easy to get started. Apply in minutes with our simple application process.
The material provided here has not been prepared in accordance with legal requirements designed to promote the independence of investment research and as such is considered to be a marketing communication. Whilst it is not subject to any prohibition on dealing ahead of the dissemination of investment research we will not seek to take any advantage before providing it to our clients.
Pepperstone doesn’t represent that the material provided here is accurate, current or complete, and therefore shouldn’t be relied upon as such. The information, whether from a third party or not, isn’t to be considered as a recommendation; or an offer to buy or sell; or the solicitation of an offer to buy or sell any security, financial product or instrument; or to participate in any particular trading strategy. It does not take into account readers’ financial situation or investment objectives. We advise any readers of this content to seek their own advice. Without the approval of Pepperstone, reproduction or redistribution of this information isn’t permitted.