- English
- 中文版
DXY:
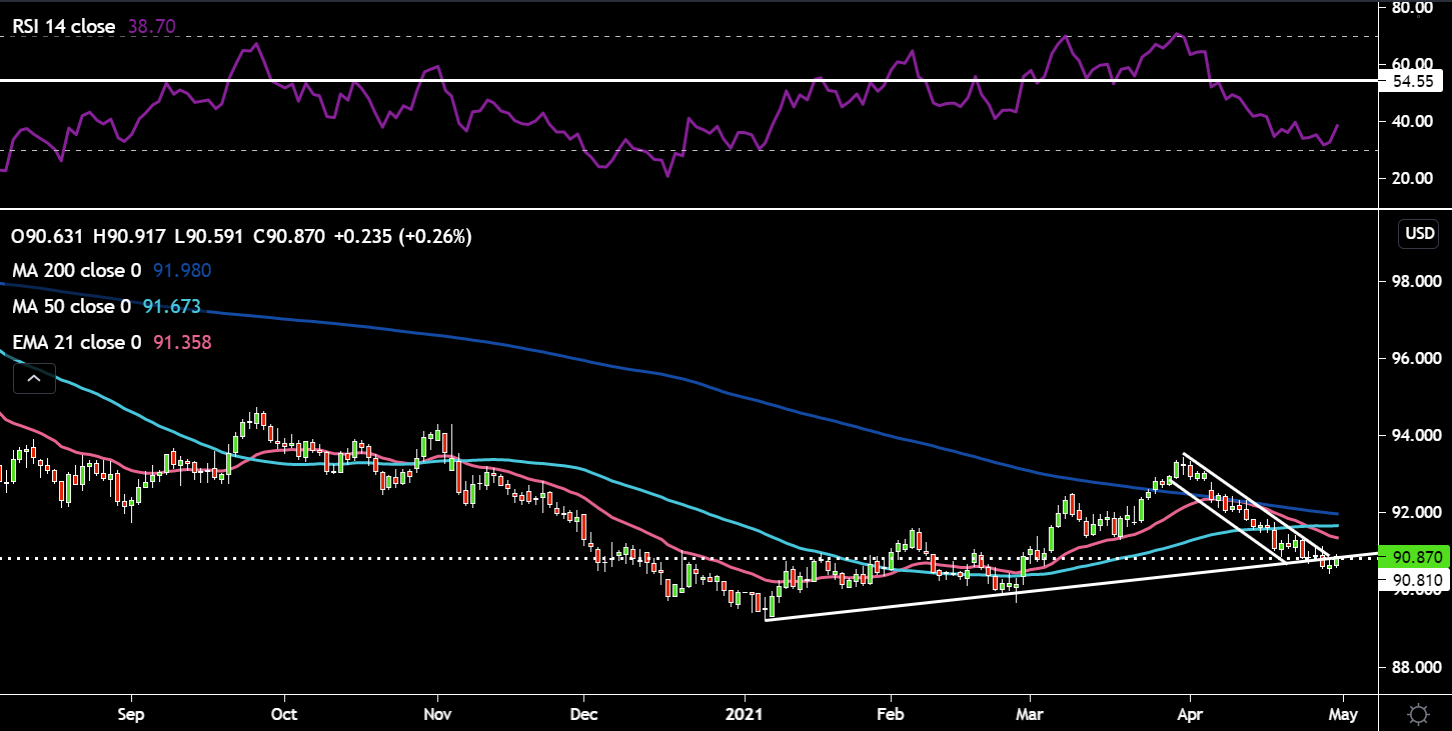
The greenback has been heading in one direction since the beginning of April – downwards. A bearish channel has formed or a bullish flag depending on your trading bias. It’s been a jam packed week in the US, we’ve had to contend with A Fed meeting, major US tech earnings and key economic data. Tech earnings have been very solid, driving the S&P higher given their large weighting in the benchmark index. In general what we see is: higher equity markets = risk-on = dollar down. I think the dollar weakness we saw post Fed meeting, was an unwinding of some minor hawkish price risk certain market participants may have been concerned about (through a miscommunication slip up). This obviously never came to fruition, Jerome Powell was like Goldilocks’ porridge - not too hot not too cold, just right. He reassured the market not to worry about accommodative support being withdrawn anytime soon. He stated yet again it was not the time to talk about tapering QE. The statement did contain some minor tweaks to reflect mild tones of strength in economic activity and employment. However, to avoid sounding too hawkish and keep things in balance they included that some risks to the economy still linger. Employment is obviously a key data point for the Fed and something that will need “substantial progress”, what substantial progress means is yet to be defined, before we see a shift in policy. Non-Farm payrolls are currently 9 mln below the February 2020 peak and the new number is out next week Friday which should top 1 mln as we head towards economic recovery. Data out yesterday was mixed with Q1 GDP beating estimates, but labour market data in the form of jobless claims missed minorly. PCE data was nothing special - in line with expectations (the Fed keeps a close eye on this inflation measurement). As we come to the end of the month rebalancing we could see some price chop and although models pointed to dollar selling, we’re actually seeing a bid. Also, not to be forgotten, May historically is a strong month for the dollar from a seasonality perspective.

The technicals look ominous for the dollar. Price has moved through the 90.8 horizontal support and the uptrend line from early January. The bearish channel continues to plumb new lows. The real question is, is this a false break or setting up for a sustained move lower. The RSI has stopped just shy of overbought levels and looks like it is trying to curl back up. It will be interesting to see where price closes into the weekend.
EURUSD:
We received a raft of economic data out from the eurozone today, although slightly stale now. Q1 GDP print of -1.8% QoQ (less than expected), it has now been confirmed that the eurozone suffered the dreaded double-dip recession. confirmed, Inflation, came out bang in line with expectations at 1.6% YoY and the core number was 0.8% YoY. Unemployment came in better than expected at 8.1% . Germany was the leakest wink on GDP and this was coupled with a big miss on GfK consumer confidence data earlier in the week. Other than that there’s not much euro specific news flow to report on, events across the pond were dictating direction for this week. Bund yields have been rising lately which also helps the single currency.

EURUSD was looking strong of late, but now seems to be paring back its gains as it peaked its head above the downtrend line around the 1.212 area. The next key price level to watch will be the 1.205 level to see if price can hold here if selling pressure persists. The 50-day SMA is still above the 200-day SMA and the shorter 21-day EMA is above the 50-day SMA and pointing skyward. The RSI definitely seems to have suffered some high altitude sickness and seems to have rolled over. Through the 1.205 region would bring the 1.20 area into sight (around the 21-day EMA).
GBPUSD:
The pound has had zero economic data out this week and like the euro took to direction from the dollar. There were some interesting developments on the political front. The EU parliament voted on the EU-UK trade deal and it passed without any hitches. We had commentary out from the EU Commission President, Von der Leyen who informed us that EU-UK talks on Northern Ireland have reached a new constructive dynamic. However, a spanner may be thrown in the works as the DUP’s Arlene Foster stepped down this week and rumours are in the air that her replacement may take a harder line on the NI protocol, this could cause more run-ins with the EU. In a recent interview with the Telegraph the deputy governor Ben Broadbent stated that the U.K. economy will see “very rapid growth at least over the next couple of quarters.” This is backed up by Goldman Sach’s latest forecasts too. Next week will be the big one for Sterling. We have two important events – Scottish Election and the BoE meeting with updated economic projections. I will do a preview on this next week.

Price just can’t seem to overcome the 1.40 handle at the moment. Could next week’s BoE meeting be the catalyst to see this sticky zone negotiated. The RSI had made some negative divergence, indicating buying momentum was weaker on this push higher. The RSI is back above 53, but has turned in a lower direction. Price is above the 21-day EMA & 50-day SMA, but I’d like to see a move above the 1.40 level and back into the ascending channel to feel more confident on longs. The 50-day SMA is ever so slightly above the 21-day EMA. We can see price has been rejected twice as it moved up to the 1.40 zone.
Gold:
Gold has been a bit lacklustre of late, looking for the next catalyst to drive direction. The bounce in US 10-year yields and the dollar won’t help gold close strong into the weekend. PCE inflation data was in line with expectations. Inflation would have to be really strong and send signals of runaway inflation for gold to continue higher and further weakness in the dollar would help send price higher. However, as the economy progresses through Q2 and tapering begins to raise its head and yields tick up representative of a stronger economy, gold could face some strong headwinds.

Gold is still above the 21-day EMA and 50-day SMA. The RSI has rolled over and is now right on the 51 level which should hold if bulls want to stay in control. $1800 is proving a bit sticky for gold, with a decisive move through here potentially triggering some stops and causing short covering. On the downside, I'd look to $1770 and $1750 (50-day SMA and 21-day EMA) as support levels. The $1770 and $1800 price levels are acting as a tight range for gold.
Oil:
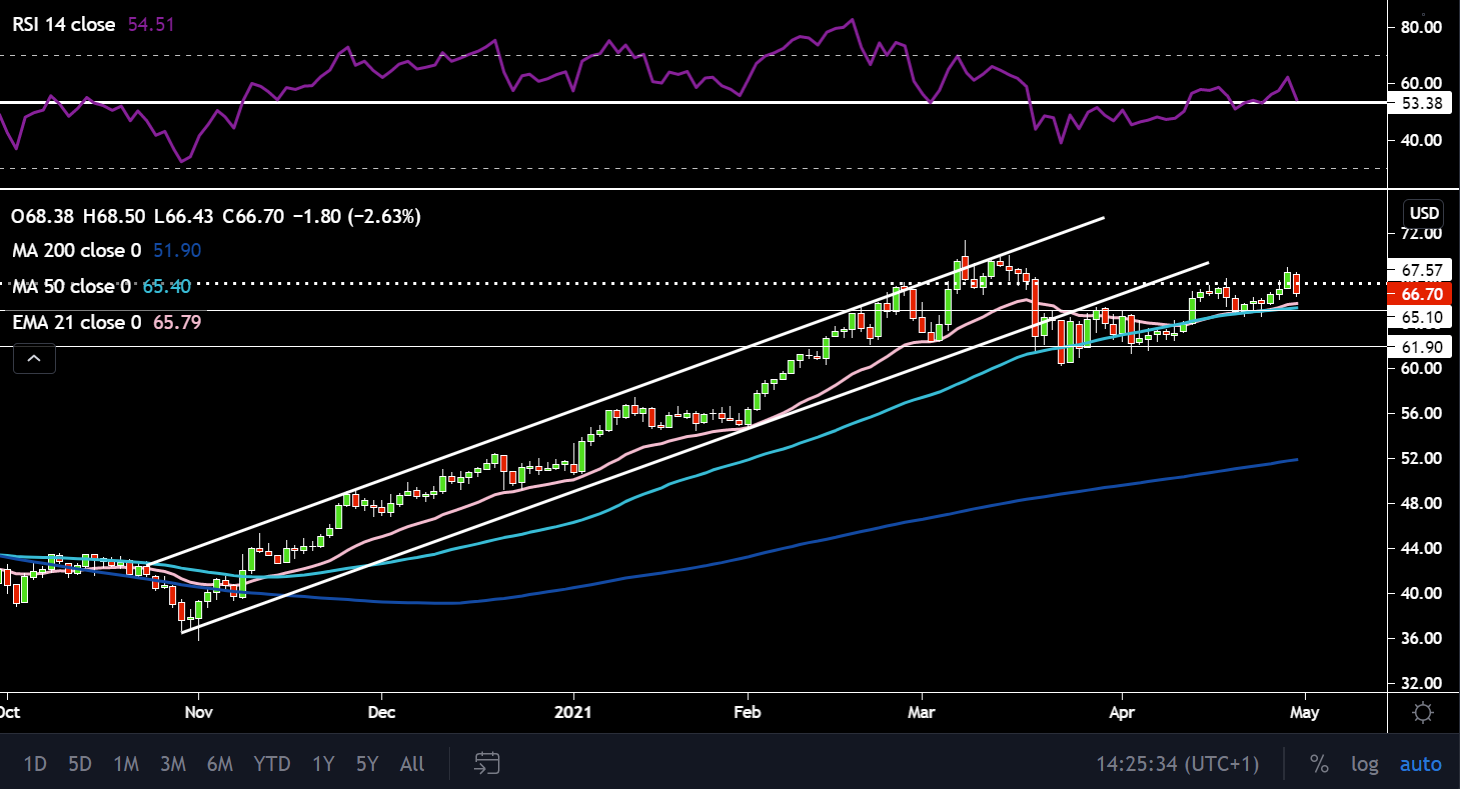
The crude complex is super interesting at the moment given the multiple moving parts of the fluid supply/demand dynamics. The big question mark was answered this week as OPEC+ decided to can their meeting, rather for June 1. This avoided any hawkish surprises for the market given the fresh lockdown in Turkey as well as the poor situations in Japan and India. As it stands 2.1 mln/bpd will hit the market over May-July. The Secretary General, gave us his macro views on the oil sector which had a positive bent to it. The trifecta of stimulus, vaccine progress and the summer travel season has him and clearly OPEC+ looking through the short term demand destruction to a strong second half later this year. Merkel also stated this week that the worst of the pandemic is behind them, indicating a brighter outlook for Europe. The other important development is talks between the US and Iran, with the Iranian President stating there has been significant progress – we’ll have to see how significant it is in lifting those sanctions. Libya also ended a force majeure on exports from a Libyan terminal leading to further supply. Inventory data saw a very slight build.

Price has returned to below $67.5 resistance, which it broke out of yesterday. Both shorter-term moving averages – 21-day EMA and 50-day SMA are slightly tilted up. The 21-day EMA has crossed above the 50-day SMA. The RSI although above the key 53 level, has turned sharply lower today. It will need to remain above this “line in the sand” to continue its ascent higher. Further moves higher needing to break $69 to move back into the ascending channel. Once those levels are cleared the March 8 highs of $71.37 come back into play. To the downside I’d monitor the former range resistance which could now act as support around $65 (also the 21-day EMA and 50-day SMA). Below that the $62 range support would come into play.
Bitcoin:
Nothing big news wise for Bitcoin this week, it’s just been deriving positive price moves from solid overall risk sentiment. A dovish Fed wouldn’t have harmed the digital currency either.

Bitcoin had briefly broken down through range support around $50.7k. Price bounced off that level and is now facing some resistance from the 21-day EMA around $54.5k within the range. The RSI is right on the key 48 level and if it can conclusively go higher above this point then Bitcoin could continue its ascent.
Related articles
Ready to trade?
It's quick and easy to get started. Apply in minutes with our simple application process.
The material provided here has not been prepared in accordance with legal requirements designed to promote the independence of investment research and as such is considered to be a marketing communication. Whilst it is not subject to any prohibition on dealing ahead of the dissemination of investment research we will not seek to take any advantage before providing it to our clients.
Pepperstone doesn’t represent that the material provided here is accurate, current or complete, and therefore shouldn’t be relied upon as such. The information, whether from a third party or not, isn’t to be considered as a recommendation; or an offer to buy or sell; or the solicitation of an offer to buy or sell any security, financial product or instrument; or to participate in any particular trading strategy. It does not take into account readers’ financial situation or investment objectives. We advise any readers of this content to seek their own advice. Without the approval of Pepperstone, reproduction or redistribution of this information isn’t permitted.
.jpg)


