• Home
  • Pro
  • Partners
  • Help and support
  • English
  • 中文版
Pepperstone logo
Pepperstone logo
  • Ways to trade
    • Trading accounts

      Choose from two account types depending on your strategy

    • Premium clients

      Exclusive rewards and bespoke benefits for high-vol traders

    • Pricing

      Discover our tight spreads, plus all other possble fees

    • Pro
    • Active trader program
    • Refer a friend
    • Demo trading
    • Trading hours
    • 24-hour trading
    • Maintenance schedule
    • Risk management
    • Funding and withdrawals
  • Markets
    • Margin FX

      Get great rates on majors like EUR/USD, plus minors and exotics

    • Commodity CFDs

      Trade on metals, energies & softs, with oil spreads from 2 cents

    • Cryptocurrency CFDs

      Speculate on Bitcoin, Ether and more, with a trusted broker

    • Share CFDs
    • Index CFDs
    • ETF CFDs
    • Currency Index CFDs
    • Dividends for index CFDs
    • Dividends for share CFDs
    • CFD forwards
  • Trading platforms
    • TradingView

      Trade through the world-famous supercharts with great pricing

    • MetaTrader 5

      Explore the apex in trading automation with our execution tech

    • The Pepperstone platform
    • MetaTrader 4
    • cTrader
    • Trading tools
    • Integrations
  • Market analysis
    • Navigating markets

      Latest news and analysis from our experts

    • The Daily Fix

      Your regular round-up of key events

    • Meet the analysts

      Our global team giving your trading the edge

  • Learn
    • Trading guides

      Trading guides & educational materials

    • Webinars

      Grow your knowledge

  • About us
    • Who we are

      Pepperstone was born from the dream of making trading better

    • Company news
    • Company awards
    • Protecting clients online
    • Trading accounts

      Choose from two account types depending on your strategy

    • Premium clients

      Exclusive rewards and bespoke benefits for high-vol traders

    • Pricing

      Discover our tight spreads, plus all other possble fees

    • Pro
    • Active trader program
    • Refer a friend
    • Demo trading
    • Trading hours
    • 24-hour trading
    • Maintenance schedule
    • Risk management
    • Funding and withdrawals
    • Margin FX

      Get great rates on majors like EUR/USD, plus minors and exotics

    • Commodity CFDs

      Trade on metals, energies & softs, with oil spreads from 2 cents

    • Cryptocurrency CFDs

      Speculate on Bitcoin, Ether and more, with a trusted broker

    • Share CFDs
    • Index CFDs
    • ETF CFDs
    • Currency Index CFDs
    • Dividends for index CFDs
    • Dividends for share CFDs
    • CFD forwards
    • TradingView

      Trade through the world-famous supercharts with great pricing

    • MetaTrader 5

      Explore the apex in trading automation with our execution tech

    • The Pepperstone platform
    • MetaTrader 4
    • cTrader
    • Trading tools
    • Integrations
    • Navigating markets

      Latest news and analysis from our experts

    • The Daily Fix

      Your regular round-up of key events

    • Meet the analysts

      Our global team giving your trading the edge

    • Trading guides

      Trading guides & educational materials

    • Webinars

      Grow your knowledge

    • Who we are

      Pepperstone was born from the dream of making trading better

    • Company news
    • Company awards
    • Protecting clients online

Vonovia & Immobilienmarkt Deutschland 2025: Neue Impulse

4 May 2025
Share
Der deutsche Immobilienmarkt sendet seit einigen Monaten leise, aber deutlich vernehmbare Signale einer Bodenbildung. Was im medialen Diskurs häufig noch unter dem Eindruck der Zinswende ...

Der deutsche Immobilienmarkt sendet seit einigen Monaten leise, aber deutlich vernehmbare Signale einer Bodenbildung. Was im medialen Diskurs häufig noch unter dem Eindruck der Zinswende und stagnierender Kauflaune steht, offenbart sich bei genauerer Analyse als zyklisch typische Bereinigung – mit einer klar erkennbaren Folge: strukturelle Angebotsverknappung bei stabiler Nachfrage.

Im Zentrum dieses Szenarios steht Vonovia, Deutschlands größter Wohnungskonzern – als repräsentativer Hebel auf ein wieder zunehmendes Preisgefüge im Bestand.


Rückblick: Von der Zinsdelle zum Angebotsdilemma

Preview
Preview
Preview

Die abrupten Zinserhöhungen ab dem Jahr 2022 stellten den Immobiliensektor vor eine klassische Neubewertung.
Nach dem Ende der Niedrigzinsphase fiel insbesondere der frei finanzierte Neubau drastisch zurück – nicht, weil keine Nachfrage existierte, sondern weil die Kalkulationen schlicht nicht mehr aufgingen.

Mittlerweile ist jedoch klar:

  • Der Rückgang der Baugenehmigungen in Deutschland hat historische Ausmaße erreicht
  • Das Niveau ist auf einem Stand, wie zuletzt 2011 – Tendenz weiter fallend
  • Gleichzeitig bleibt die Bevölkerungsentwicklung (Zuwanderung, Demografie, Urbanisierung) nachfragestützend

Diese strukturelle Differenz zwischen Angebot und Nachfrage entfaltet sich nun zunehmend auch in den Kursverläufen der großen Bestandshalter, die von einem wertstabilen Portfolio profitieren – allen voran Vonovia.


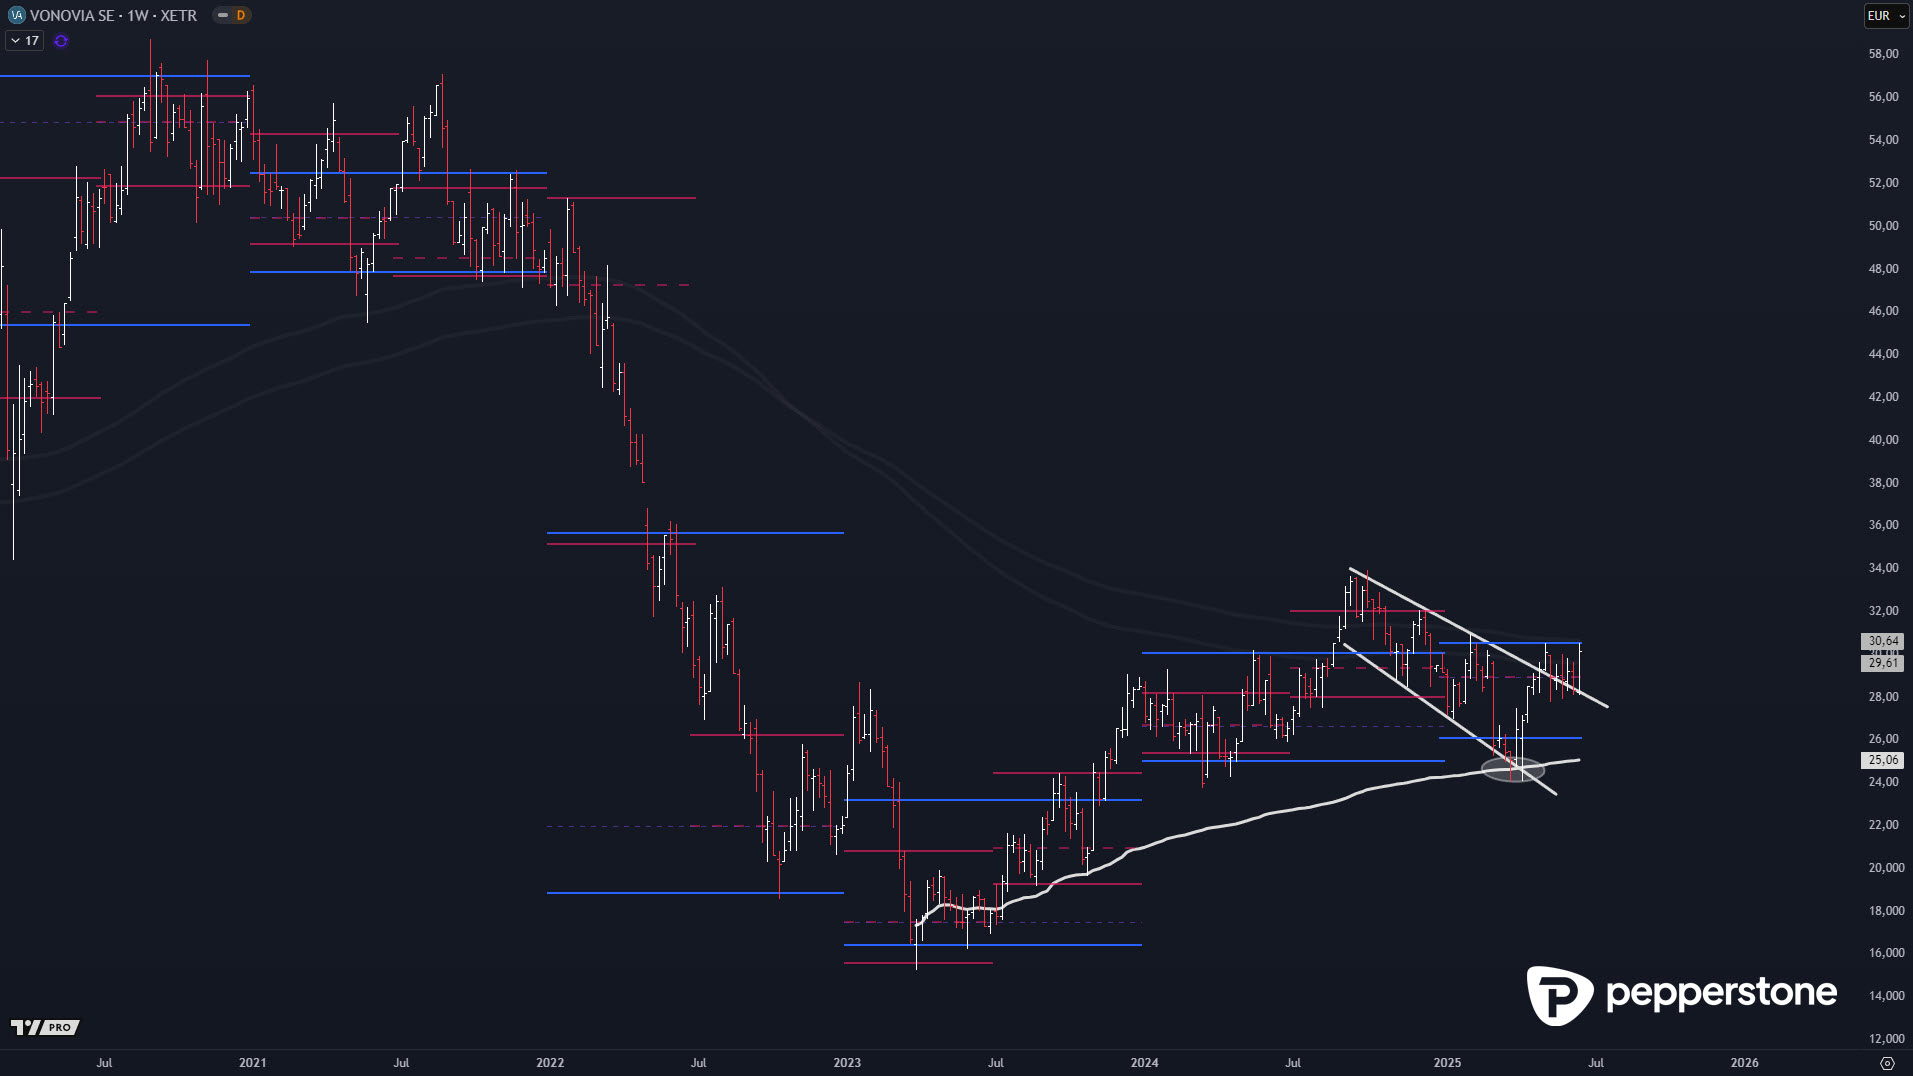
Technische Einordnung: Vonovia mit stabiler Bodenbildung

Die charttechnische Analyse bestätigt das übergeordnete Szenario.


Wochenchart – strategische Ausgangslage

Preview

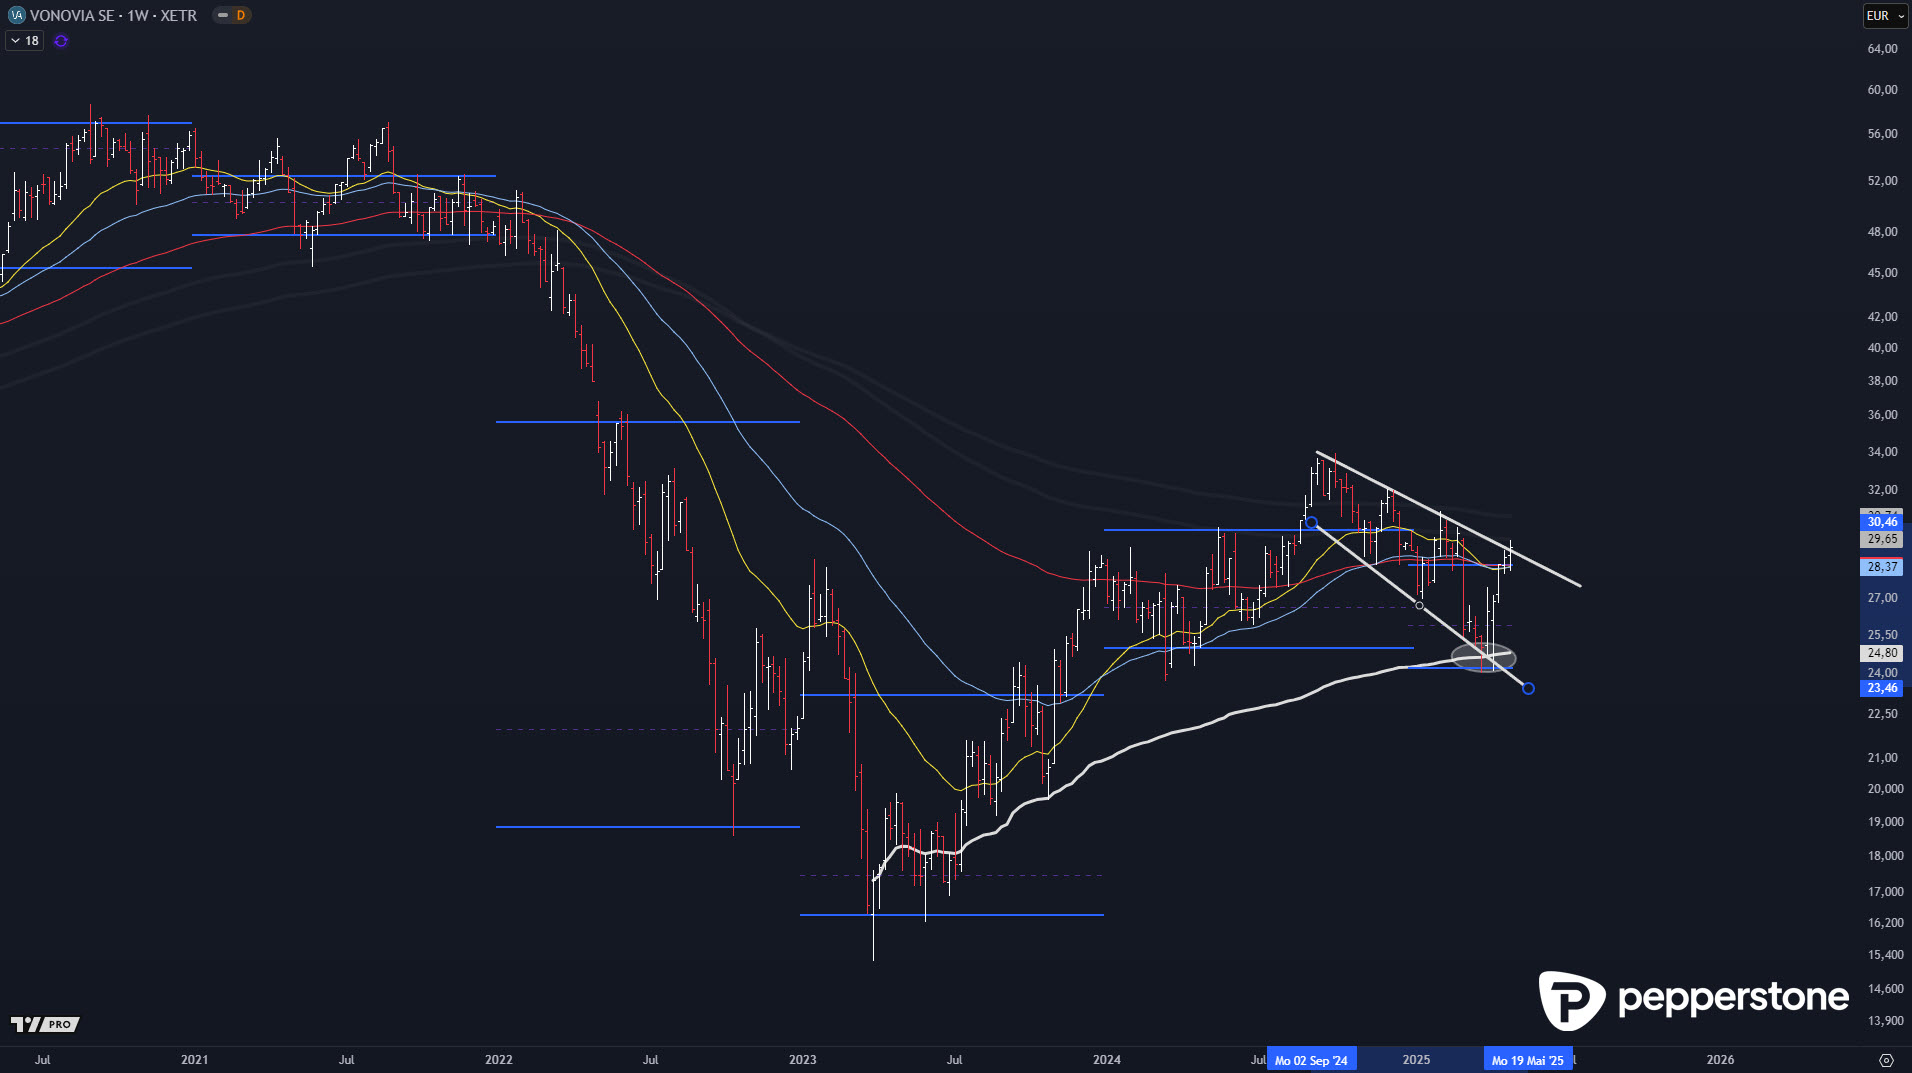
Nach einer ausgedehnten Korrektur, die ihren Höhepunkt im Sommer 2023 fand, konnte Vonovia einen klar definierten Boden ausbilden.
Dieser wird gestützt durch:

  • den volumengewichteten Durchschnitt (Anchored VWAP) aus der übergeordneten Abwärtsbewegung
  • sowie die Value Area Low des vorherigen Jahres, die erfolgreich verteidigt wurde

Diese doppelte Unterstützungszone bei rund 22–24 EUR stellte sich im Nachhinein als klassischer Wendepunkt dar, an dem institutionelle Marktteilnehmer sichtbar aktiv wurden.
Die Kursdynamik zog im Anschluss sichtbar an – mit einem ersten mittelfristigen Zielbereich bei etwa 60 EUR.


Wochenchart: Update 1 - 22.06.2025

Preview

Stundenchart – operative Marken im Fokus

Preview

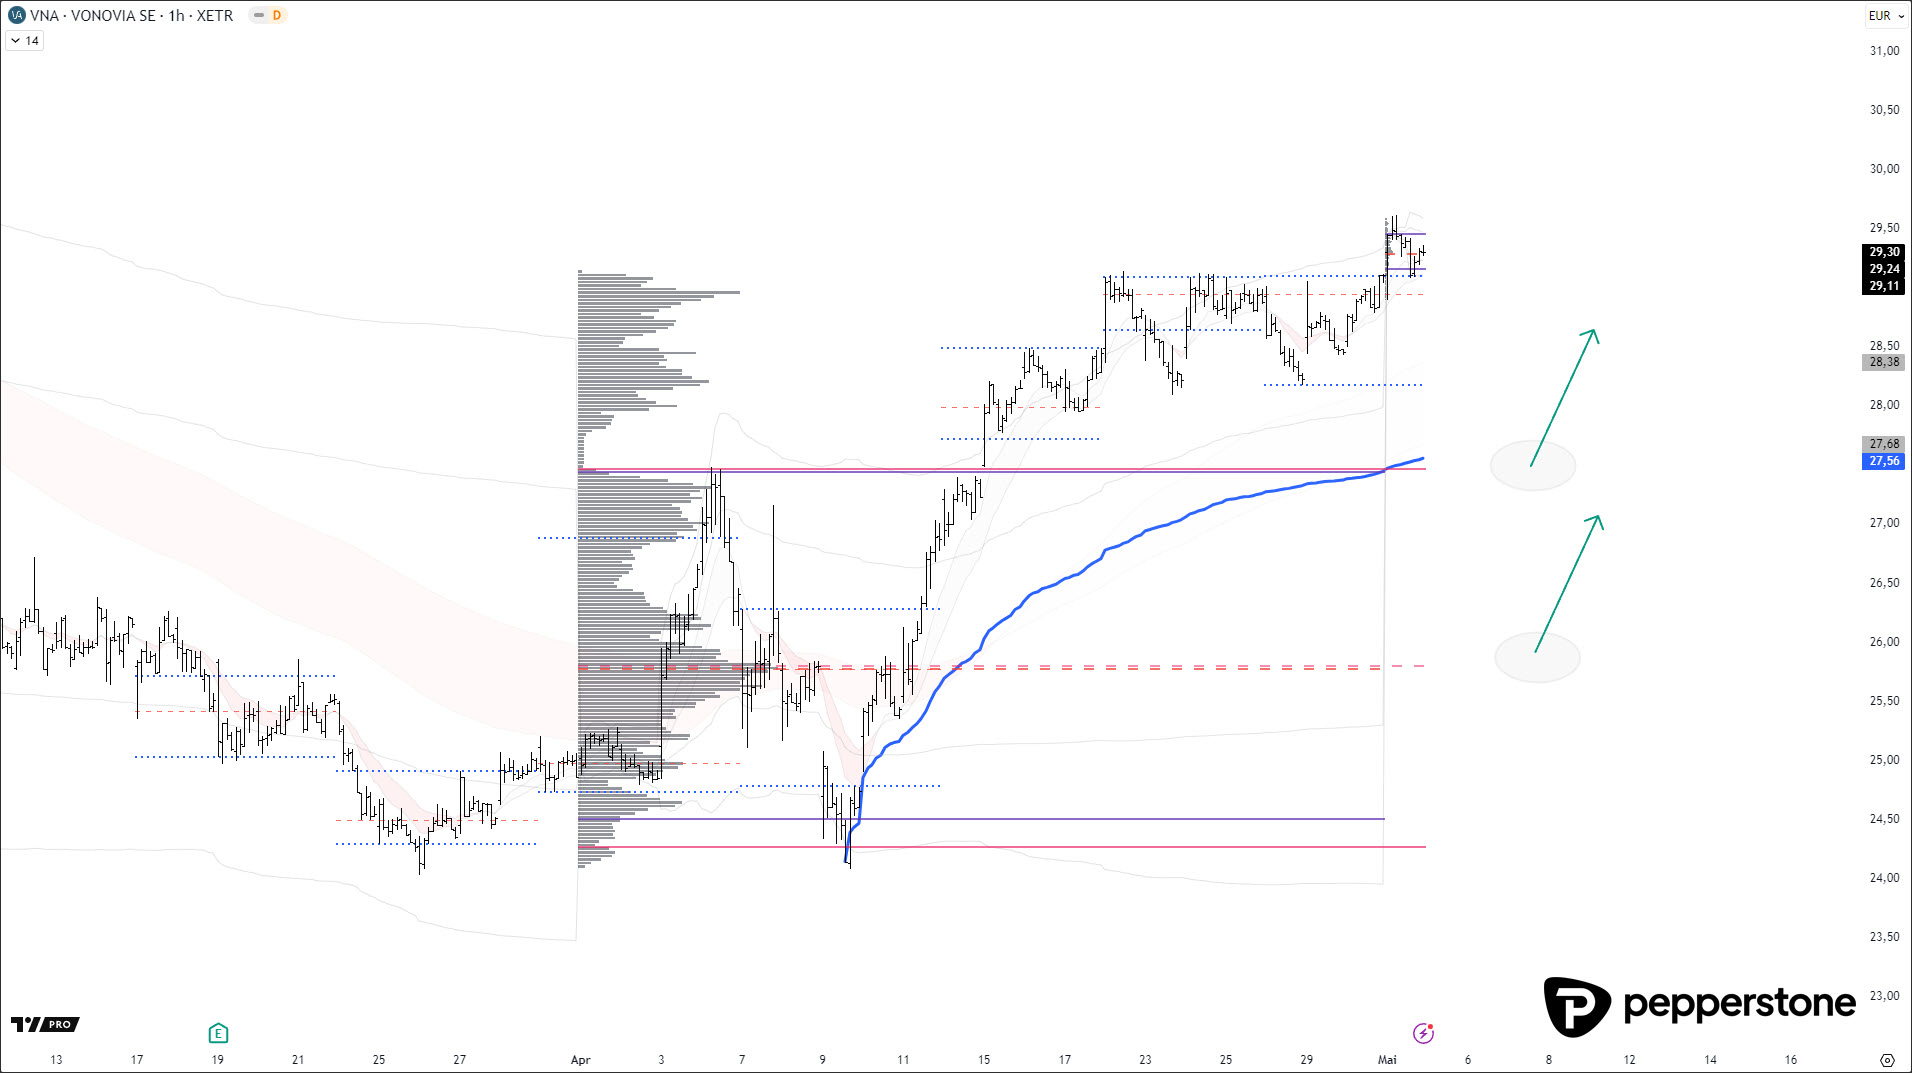
Auf untergeordneter Ebene zeigt sich ein klarer Wechsel in der Marktstruktur.
Die Aktie bildet höhere Tiefs und höhere Hochs – ein klassisches Merkmal bullischer Umkehrformationen.

Zentraler Unterstützungsbereich:

  • Volumengewichteter Durchschnitt (VWAP) im Bereich 27 EUR
  • Unterstützungszone zwischen 26 und 27 EUR, gut bestätigt im kurzfristigen Zeitrahmen

Diese Marken gelten als operative Einstiegszonen bei Rücksetzern – vorausgesetzt, der Markt zeigt dort klare Stabilisierungsmuster. Eine direkte Order ohne Bestätigung birgt wie immer das Risiko eines „fallenden Messers“.


Stundenchart: Update 1 - 22.06.2025

Preview

Makro trifft Technik: Warum Vonovia langfristig Rückenwind hat

Das politisch-ökonomische Gesamtbild spricht klar für einen längerfristigen Aufwärtsimpuls:

  • Die Bundesregierung schafft es absehbar nicht, das selbst gesteckte Neubauziel von 400.000 Einheiten jährlich zu erreichen
  • Gleichzeitig explodieren die Herstellungskosten durch Materialpreise, Fachkräftemangel und administrative Auflagen
  • Die Nachfrage hingegen bleibt stabil – Wohnen ist ein Grundbedürfnis und in Ballungsräumen längst strukturell unterversorgt

In dieser Gemengelage sind große Bestandshalter wie Vonovia klar im Vorteil:

  • Sie besitzen skalierbare Portfolios
  • Haben politische Anschlussfähigkeit (Förderungen, Mietdeckel etc.)
  • Und bieten Investoren langfristig planbare Einnahmeströme

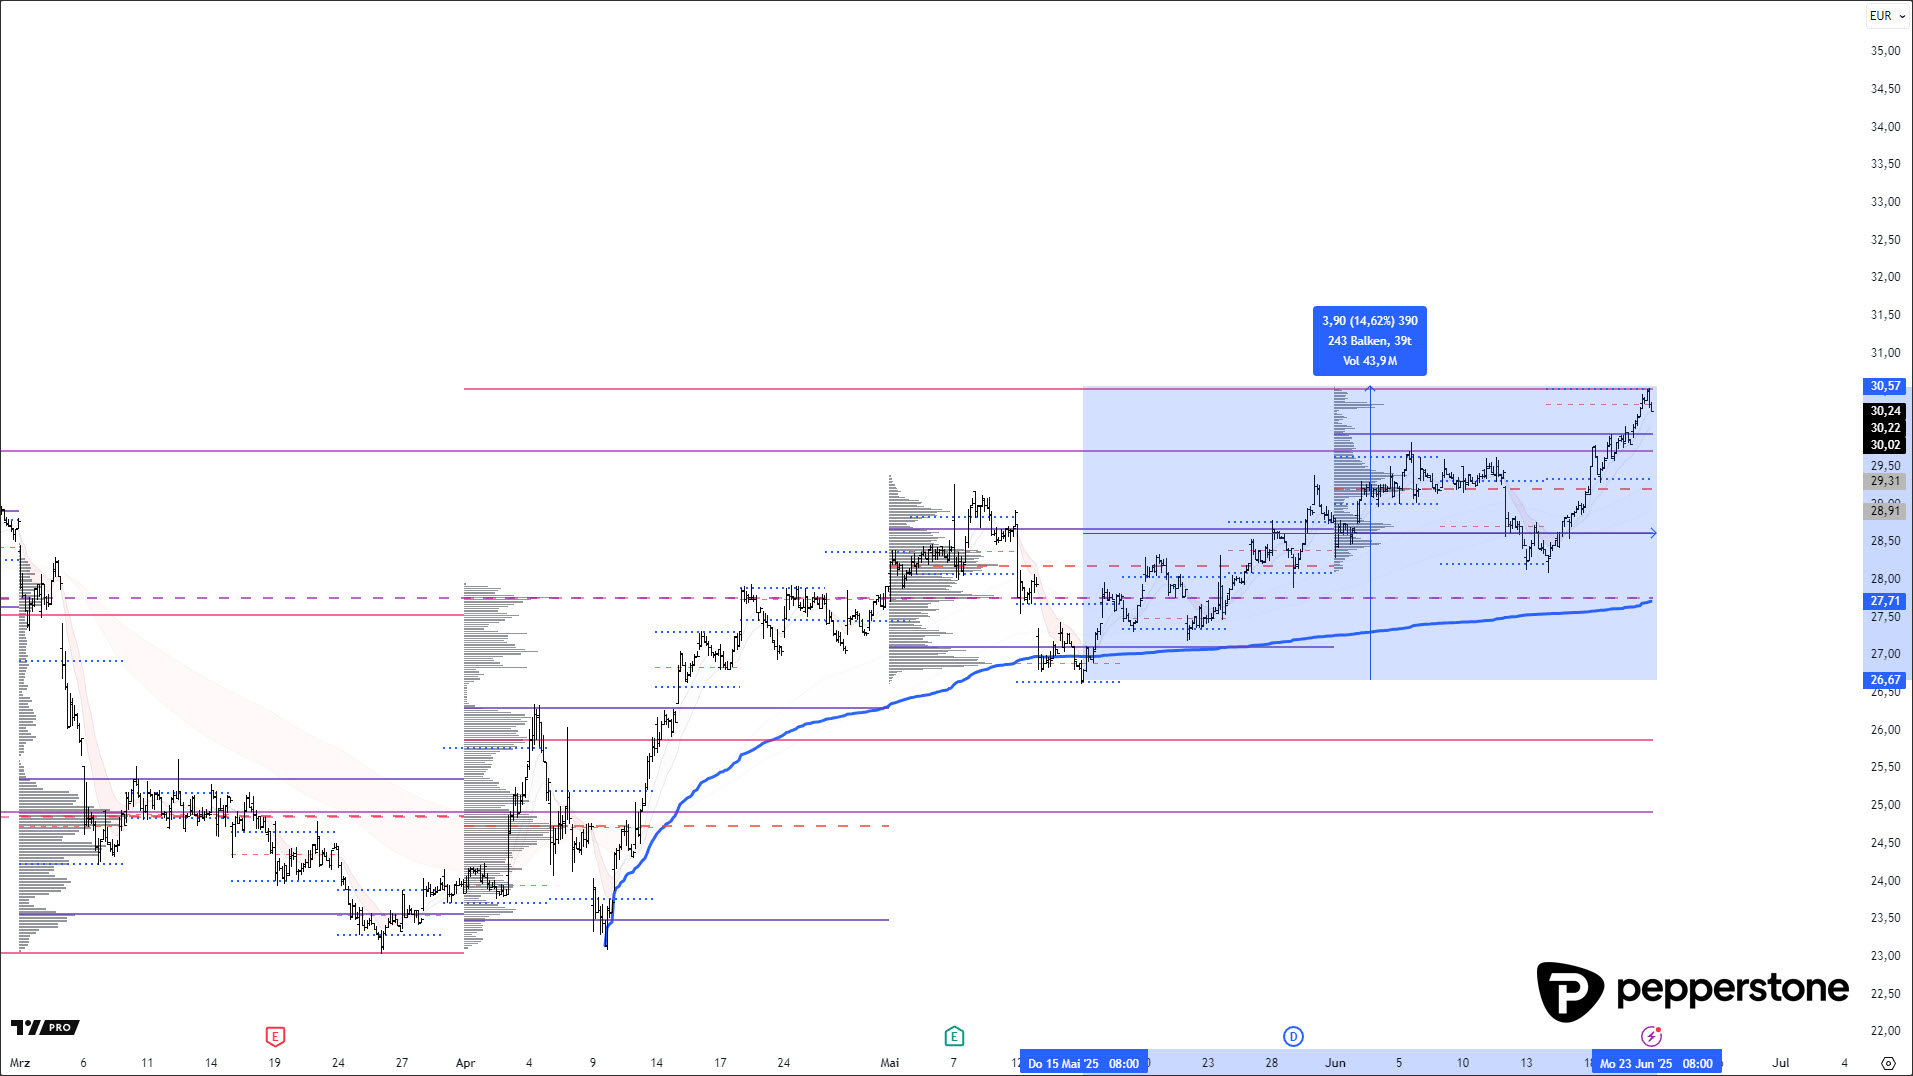
Die technische Lage verstärkt dieses Bild:
Solange die Zone zwischen 26 und 27 EUR hält, bleibt das Setup übergeordnet bullisch. Rückläufe in diesen Bereich können – bei entsprechender Reaktion – für Positionsaufbau genutzt werden.


Vonovia zeigt ähnliche Muster wie Microsoft, Nasdaq & SAP

Das jüngste Verhalten der Vonovia-Aktie erinnert in seiner Struktur an klassische Setups aus den letzten Wochen:

  • Bei Microsoft führte eine klare Korrektur an volumengestützte Marken zu einem mustergültigen Rebound
  • Im Nasdaq 100 sorgten tiefere Value Areas für präzise Einstiege
  • Auch SAP zeigte nach Absorption an der Value Area High eine planbare Umkehr

In allen Fällen zeigte sich das gleiche institutionelle Muster:
Zielgerichtete Korrektur – Liquiditätsaufnahme – Impulsbildung

Diese sich wiederholenden Strukturen sind das Rückgrat strategischen Tradings.

Herzliche Grüße aus Berlin,

Dennis Gürtler.


Related articles

Brent / WTI: Stop-Run vollzogen - Trapped Sellers ausgelöst!

Brent / WTI: Stop-Run vollzogen - Trapped Sellers ausgelöst!

Nvidia & Nasdaq: Absorption als Frühwarnsignal – institutionelles Playbook

Nvidia & Nasdaq: Absorption als Frühwarnsignal – institutionelles Playbook

The material provided here has not been prepared in accordance with legal requirements designed to promote the independence of investment research and as such is considered to be a marketing communication. Whilst it is not subject to any prohibition on dealing ahead of the dissemination of investment research we will not seek to take any advantage before providing it to our clients.

Pepperstone doesn’t represent that the material provided here is accurate, current or complete, and therefore shouldn’t be relied upon as such. The information, whether from a third party or not, isn’t to be considered as a recommendation; or an offer to buy or sell; or the solicitation of an offer to buy or sell any security, financial product or instrument; or to participate in any particular trading strategy. It does not take into account readers’ financial situation or investment objectives. We advise any readers of this content to seek their own advice. Without the approval of Pepperstone, reproduction or redistribution of this information isn’t permitted.

Other sites

  • The Trade Off
  • Partners
  • Group
  • Careers

Ways to trade

  • Pricing
  • Trading accounts
  • Pro
  • Premium Clients
  • Active Trader program
  • Refer a friend
  • Trading hours

Platforms

  • Trading Platforms
  • TradingView
  • MT5
  • MT4
  • cTrader
  • Trading tools

Markets & Symbols

  • Forex
  • Shares
  • ETFs
  • Indices
  • Commodities
  • Currency indices
  • Cryptocurrencies
  • CFD Forwards

Analysis

  • Navigating Markets
  • The Daily Fix
  • Meet the analysts

Learn to Trade

  • Trading Guides
  • Videos
  • Webinars
Pepperstone logo
support@pepperstone.com
1300 033 375
Level 16, Tower One, 727 Collins Street
Melbourne, VIC Australia 3008
  • Legal documents
  • Privacy policy
  • Website terms and conditions
  • Cookie policy
  • Whistleblower Policy
  • Sitemap

© 2025 Pepperstone Group Limited

Risk Warning: Trading CFDs and margin FX is risky. It isn't suitable for everyone and if you are a professional client, you could lose substantially more than your initial investment. You don't own or have rights in the underlying assets. Past performance is no indication of future performance and tax laws are subject to change. The information on this website is general in nature and doesn't take into account your personal objectives, financial circumstances, or needs. You should consider whether you’re part of our target market by reviewing our TMD, and read our PDS and other legal documents to ensure you fully understand the risks before you make any trading decisions. We encourage you to seek independent advice if necessary.

Pepperstone Group Limited is located at Level 16, Tower One, 727 Collins Street, Melbourne, VIC 3008, Australia and is licensed and regulated by the Australian Securities and Investments Commission.

The information on this site and the products and services offered are not intended for distribution to any person in any country or jurisdiction where such distribution or use would be contrary to local law or regulation.

© 2024 Pepperstone Group Limited | ACN 147 055 703 | AFSL No.414530