- English
- 中文版

Asia will be looking at a mixed open for the new week, despite taking inspiration from the fact European markets closed strongly, while the S&P500 closed +0.4% and knowing there has been real momentum and pullbacks will be hovered up.
If we look at the index opening calls, which largely reflect the change in futures markets from the close of the cash session, it should be a fairly uneventful open for Japan and HK, while the ASX 200 will continue its outperformance, where we see Aussie SPI futures some 42-points higher from 16:10 AEDT.
Markets priced for perfection
We can look at the technical indicators, and it won't surprise to see traditional oscillators, such as the RSI or stochastics at ‘overbought’ levels, although, these are best utilised as confirmation tools, for when price is rolling over, or identifying potential reversals when divergence (with price) can be seen. We can look at valuation but timing an index pullback based off record high 12-month price-to-earnings ratio is tough, and a factor that most traders wouldn’t look at too closely, especially in a world driven by liquidity dynamics and money supply.
Red flags for global indices
It’s a red flag that small caps are underperforming larger-cap stocks, while defensive sectors are starting to outperform cyclical sectors again. The CBOE US equity put/call ratio sits at the sixth percentile of the five-year range and again that gives us a sense that the skew in options structures has got incredibly one-sided. We can look at implied volatility and see various measures at rock bottom levels, with the VIX index closing at 12.10%, while notably in FX markets, the JP Morgan global FX vol index closed at a record low.
If its sentiment or euphoria we want to assess (notably in equities) then market internals can be a fantastic guide, offering a sense that a market’s elastic band has been pulled too far. If I look solely at the S&P500 I see signs that markets are genuinely priced for perfection:
- The 5-day average advance-decline line is moving towards 200 – highest since 14 October
- The number of companies at 52-week highs at 128 - the highest January 2018
- Percentage of companies above their 50-day MA at 83.5% - highest July 2019
- Percentage of the index with an RSI above 70 at 27.7% - highest February 2019.
Of course, we can see a similar theme across other global equity indices that have performed well. The point is, the risk of a 3%-5% pullback is material, but shorts have been an awful trade of late and what is deemed ‘stretchered’, or ‘overbought’, just keeps soldiering on. What is clear though is when genuinely bad news does hit a market positioned this way, it will hit risk just that bit harder.
What constitutes genuinely negative news?
Consider that last week China’s data dump was pretty good, especially the credit data. US data had something for the policy hawks and doves, although bond markets have moved sideways, and unless we see some vol in fixed income then FX will stay subdued.
From a psychological perspective, I felt it was positive that the USD index closed +0.3% on Friday, with the gains largely coming against the GBP and EUR. It seemed like traders are still searching out good news, focusing more intently on a huge 16.9% lift in housing starts, than the sizeable drop in job openings (seen in the JOLTS report), with the multi-year uptrend in job openings giving way.
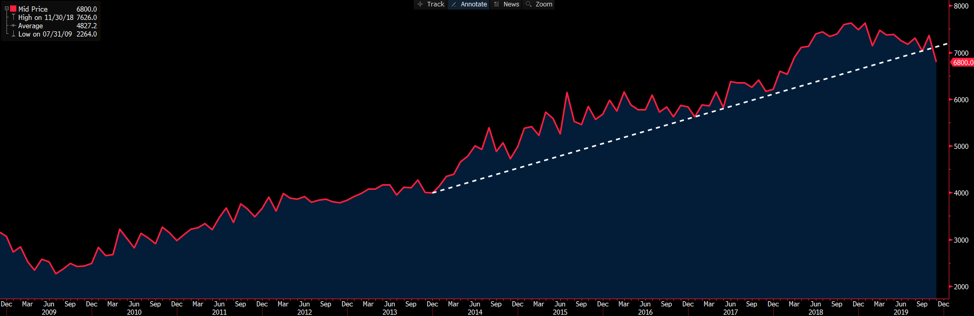
(Source: Bloomberg)
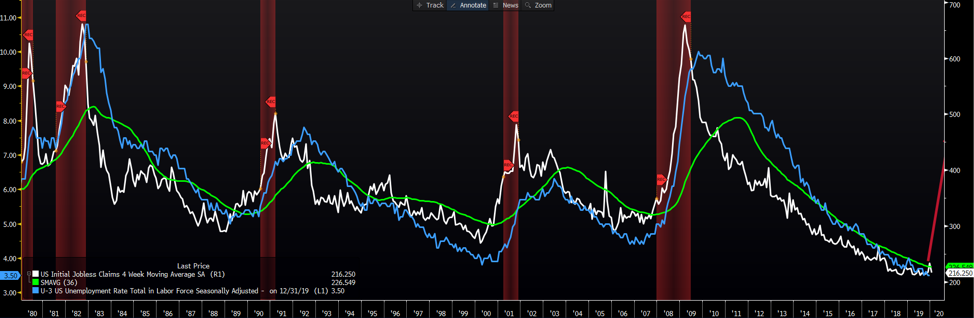
I guess this chart of job openings are something to keep an eye on, although when it comes to the US labour market my preferred guide is weekly jobless claims. If we see the 4-week moving average of weekly jobless claims (white) accelerate higher, breaking above the 3-year average (green), we often see the rate of change start to move aggressively higher taking the US (U3) unemployment rate with it. The red shaded areas are periods of recession.
So, we start the week on a somewhat positive footing, with risk and carry in vogue and subdued volatility. As touched upon, the data needs to reflect the more certain outlook, given the path of politics/geopolitics. It will, therefore, be interesting to focus on the relationship between France and the US this week, with the potential for the US to place 100% tariffs on French goods, but if this plays out, is this enough to spark genuine concerns about trade again? I am not so sure. Aside from the Davos shindig, where we get a whole raft of central bankers speaking, we get policy meetings from the BoJ, ECB, BoC, and Norges Bank.
Economic data simply has to continue improving, as will be the case in US corporate earnings, which ramp up this week. The data needs to reflect the fact we have a Phase One trade deal, signs of certainty in the UK (post-election), China’s credit impulse moving higher, and we have a Fed who are ensuring the repo market is functioning and most believe the asset purchases (notably T-bills) amounts to QE. This week’s PMI data from Europe, UK and China (next week) will be of interest then, especially with the consensus expecting a rebound. The German ZEW survey (tomorrow 21:00 AEDT) needs to be considerably less bad or vols should lift.
If I had to pick two data points for the week ahead though I’d be looking at Aussie jobs on Thursday and UK PMI on Friday. When rates markets are pricing cuts at 55% and 70% respectively, poor numbers in these data points will seal the deal at the next central bank meeting.
Ready to trade?
It's quick and easy to get started. Apply in minutes with our simple application process.
The material provided here has not been prepared in accordance with legal requirements designed to promote the independence of investment research and as such is considered to be a marketing communication. Whilst it is not subject to any prohibition on dealing ahead of the dissemination of investment research we will not seek to take any advantage before providing it to our clients.
Pepperstone doesn’t represent that the material provided here is accurate, current or complete, and therefore shouldn’t be relied upon as such. The information, whether from a third party or not, isn’t to be considered as a recommendation; or an offer to buy or sell; or the solicitation of an offer to buy or sell any security, financial product or instrument; or to participate in any particular trading strategy. It does not take into account readers’ financial situation or investment objectives. We advise any readers of this content to seek their own advice. Without the approval of Pepperstone, reproduction or redistribution of this information isn’t permitted.