How to trade AUD/USD: Influential factors and essential strategies
AUD/USD offers significant opportunities but requires a solid understanding of the factors influencing its price. This guide covers essential strategies, market insights, and key indicators to help navigate AUD/USD effectively.

What is the AUD/USD currency pair and how does it work?
The AUD/USD currency pair reflects the exchange rate between the Australian Dollar (AUD) and the US Dollar (USD). For example, if AUD/USD is quoted at 0.66, it means that 1 Australian Dollar is worth 0.66 US Dollars.
What factors impact the price of AUD/USD?
The AUD/USD is influenced by a whole host of factors, including economic indicators, commodity prices, geopolitical events, and market sentiment:
- Central Bank Policies: Interest rates set by the Reserve Bank of Australia (RBA) and the U.S. Federal Reserve (Fed) directly impact the currency pair. Higher rates attract foreign investment, typically strengthening the respective currency.
- Commodity Prices: As a major exporter, Australia’s currency is particularly sensitive to global commodity prices like iron ore and coal. Rising commodity prices and strong demand from key trading partners like China often support the AUD.
- Trade Balance: A trade surplus or a positive current account (where export revenues exceed import costs) generally strengthens the AUD. Conversely, a deficit can weaken it.
- Geopolitical Events: Political stability, trade relations, and international events influence investor confidence and affect AUD/USD. Risk appetite influences the AUD positively with it being considered a "risk-on" currency. Market volatility or uncertainty often drives investors toward “safe haven” assets, such as the USD.
- Global Economic Conditions: Positive growth in economies trading with Australia, particularly China, and stable global markets generally favour the AUD, while global crises drive demand for the USD as a safe haven.
How is AUD/USD affected by interest rate changes in Australia and the US?
Interest rate changes are a critical factor in AUD/USD pricing. Higher interest rates generally make a currency more attractive to investors because of the potential for better returns on bonds and savings. If the RBA raises rates, it may strengthen the AUD relative to USD, and vice versa if the Fed raises rates.
The interest rate differential between Australia and the US often determines the flow of capital. Traders monitor monetary policy statements, inflation reports, and central bank commentary for signs of future rate changes.
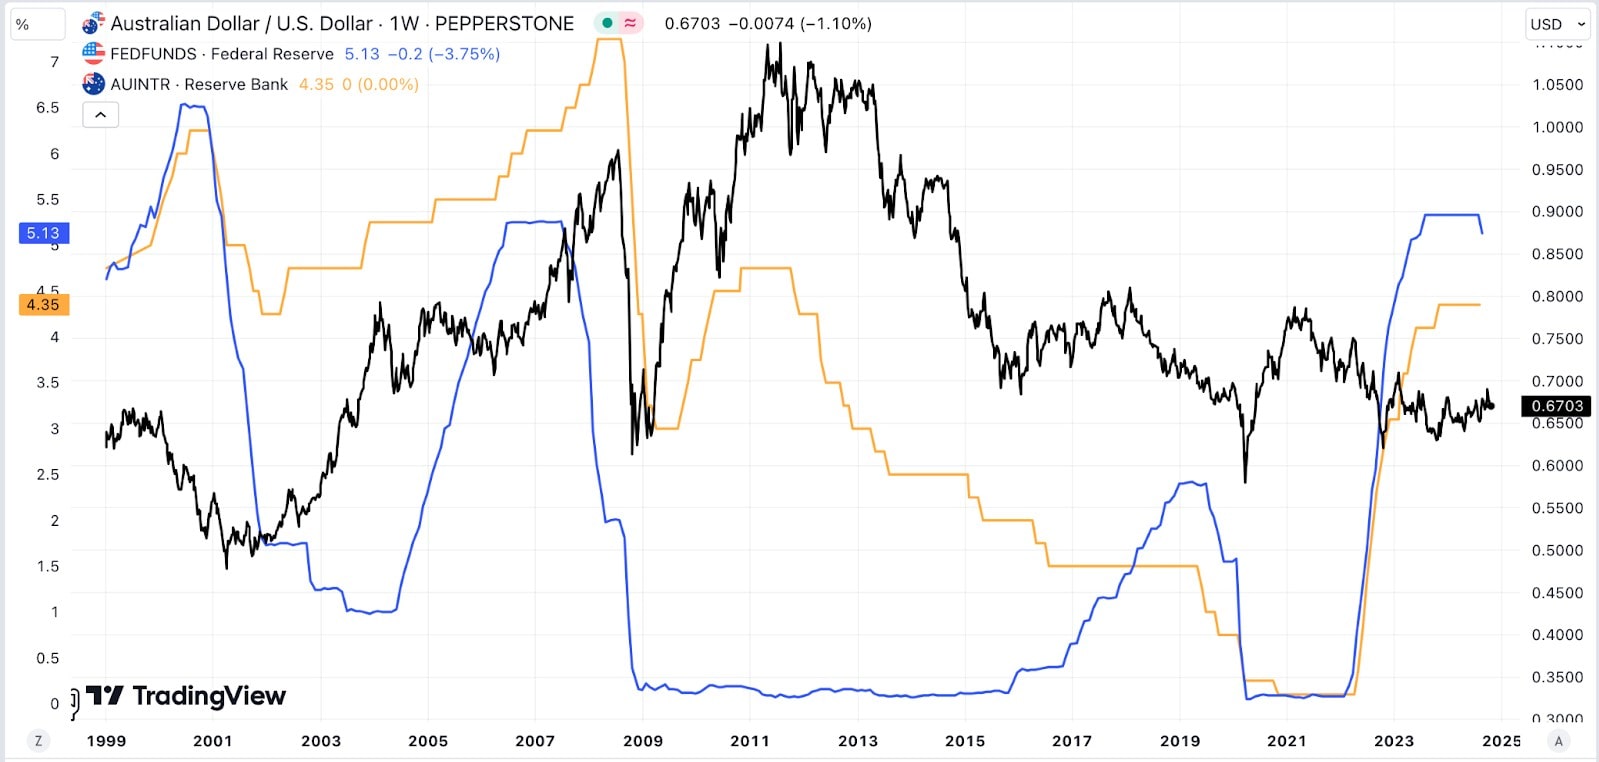
The chart above illustrates how interest rate differentials between the U.S. and Australia influence the AUD/USD exchange rate. When the RBA rate is higher than the Fed rate, the AUD tends to strengthen, as seen from 2000 to 2008 and 2011 to 2013. Recent hikes in the Fed rate relative to the RBA rate (since 2022) have correlated with AUD weakness.
Tracking Interest Rate Expectations
The RBA Rate Tracker on the Australian Securities Exchange (ASX) provides a tool for gauging market expectations about future RBA rate decisions. By tracking interest rate futures, the RBA Rate Tracker calculates the implied probability of changes to the RBA’s cash rate target. This tool allows traders to anticipate RBA policy adjustments, as any expected or unexpected changes to the cash rate can impact the AUD/USD pair.
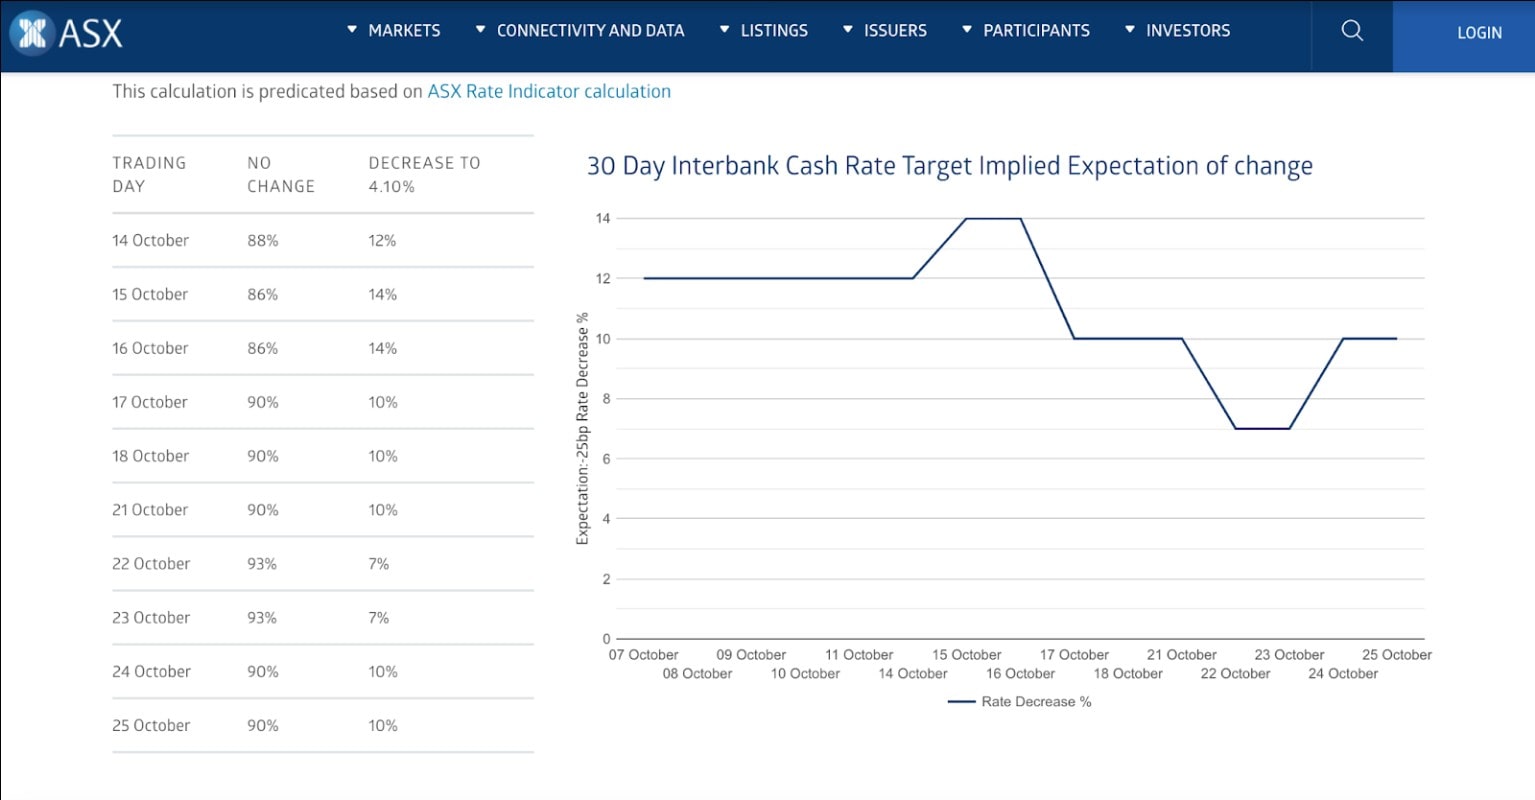
Source: RBA Rate Tracker
What is the optimal times to trade AUD/USD for high liquidity?
The most liquid trading hours for AUD/USD are during the overlap between the Asian and US trading sessions:
- Sydney/Tokyo overlap: 10:00 PM – 2:00 AM GMT
- London/New York overlap: 12:00 PM – 4:00 PM GMT
Liquidity is highest during these times, offering tighter spreads and lower slippage.
How does commodity pricing, like iron ore or gold, influence AUD/USD?
Commodity prices, particularly iron ore and gold, are arguably the biggest drivers of sentiment related to AUD/USD price action due to Australia's large export economy, where these metals are the primary exports. Changes in the prices of these commodities can lead to swings in AUD, as higher prices typically strengthen AUD while lower prices can weaken it:
Iron Ore: Australia is the world’s largest exporter of iron ore, and thus plays a key role in the country's economic growth. As a result, there is a strong positive correlation between iron ore prices and the AUD. The correlation between iron ore prices and AUD/USD can be as high as 0.80 during periods of strong global demand for commodities, reflecting a close relationship. When iron ore prices rise, Australia’s export revenues increase, boosting economic performance and investor confidence leading to a stronger AUD. Conversely, falling iron ore prices tend to weaken the AUD as export revenues decline.
Gold: Gold is another key export for Australia, making up a significant part of its mining sector. Gold prices also have an impact on the AUD, although the correlation is less direct compared to iron ore. The relationship between gold prices and the AUD tends to be positive because Australia benefits from higher gold export revenues when prices rise.
However, gold also plays a safe-haven role in global markets, meaning that during periods of risk aversion, investors may seek gold, which can boost the AUD. On the other hand, if global economic uncertainty leads to increased demand for the US Dollar as a safe-haven currency, it could offset gains in AUD from higher gold prices.
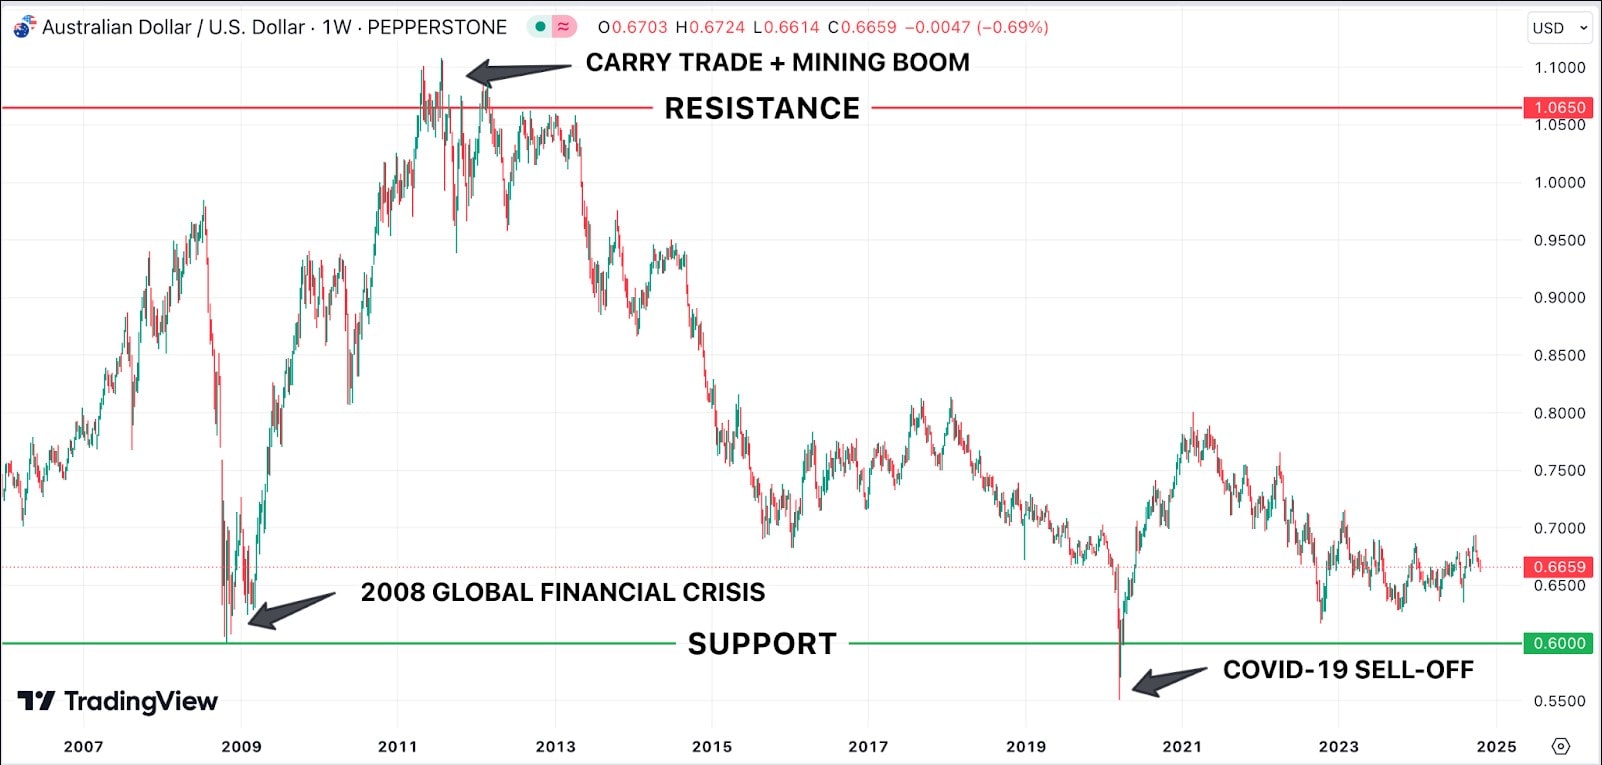
What are the key support and resistance levels for AUD/USD?
Support and resistance levels are critical to any technical trading. Identifying historical support and resistance zones helps in timing trades, managing risk, and spotting breakout opportunities. These zones reflect recurring market sentiment, helping traders anticipate future price movements helping in timing trades, managing risk, and spotting breakout opportunities. These are the key long-term and short-term support and resistance levels to consider in AUD/USD:
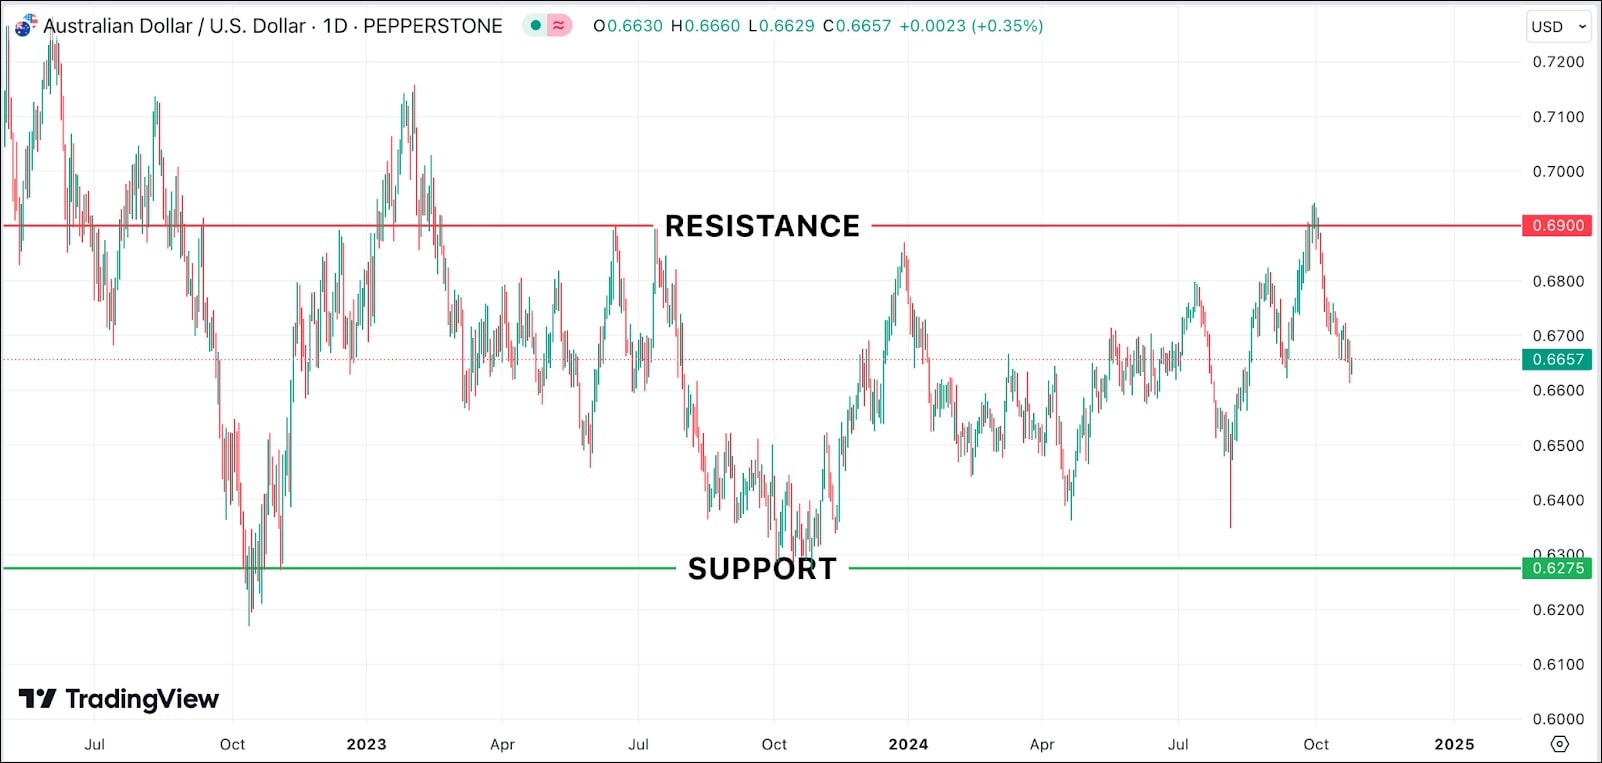
*Be aware that trend lines identify ZONES of support and resistance as opposed to exact prices.
Long-Term Support Level: 0.6000
Long-Term Resistance Level: 1.0650
Short-Term Support Level: 0.6275
Short-Term Resistance Level: 0.6900
Which technical indicators work best for trading AUD/USD?
The best indicators often depend on the trading style (e.g., day trading, swing trading) and market conditions. Many traders use a combination of indicators to confirm signals and enhance trading strategies. Backtesting and practice are crucial for determining which indicators work best for the adopted trading approach in the AUD/USD market. Some of the most popular technical indicators to consider include:
- Moving Averages - (e.g., 50- and 200-day) to identify trends.
- Relative Strength Index (RSI) - to identify overbought or oversold conditions.
- MACD (Moving Average Convergence Divergence) - to detect trend changes.
How can I use moving averages to identify trends in AUD/USD?
Moving averages (MA) help smooth out price data and highlight trends. There are two main types of moving averages used in trading:
- Simple Moving Average (SMA): The average price over a specific number of periods. It gives equal weight to all prices.
- Exponential Moving Average (EMA): Gives more weight to recent prices, making it more responsive to recent changes in price.
Choosing Time Frames
- Short-Term: For day trading, consider using the 5-, 10-, or 20-day moving averages
- Medium-Term: For swing trading, the 50- or 100-day.
- Long-Term: For position trading, the 200-day is commonly used.
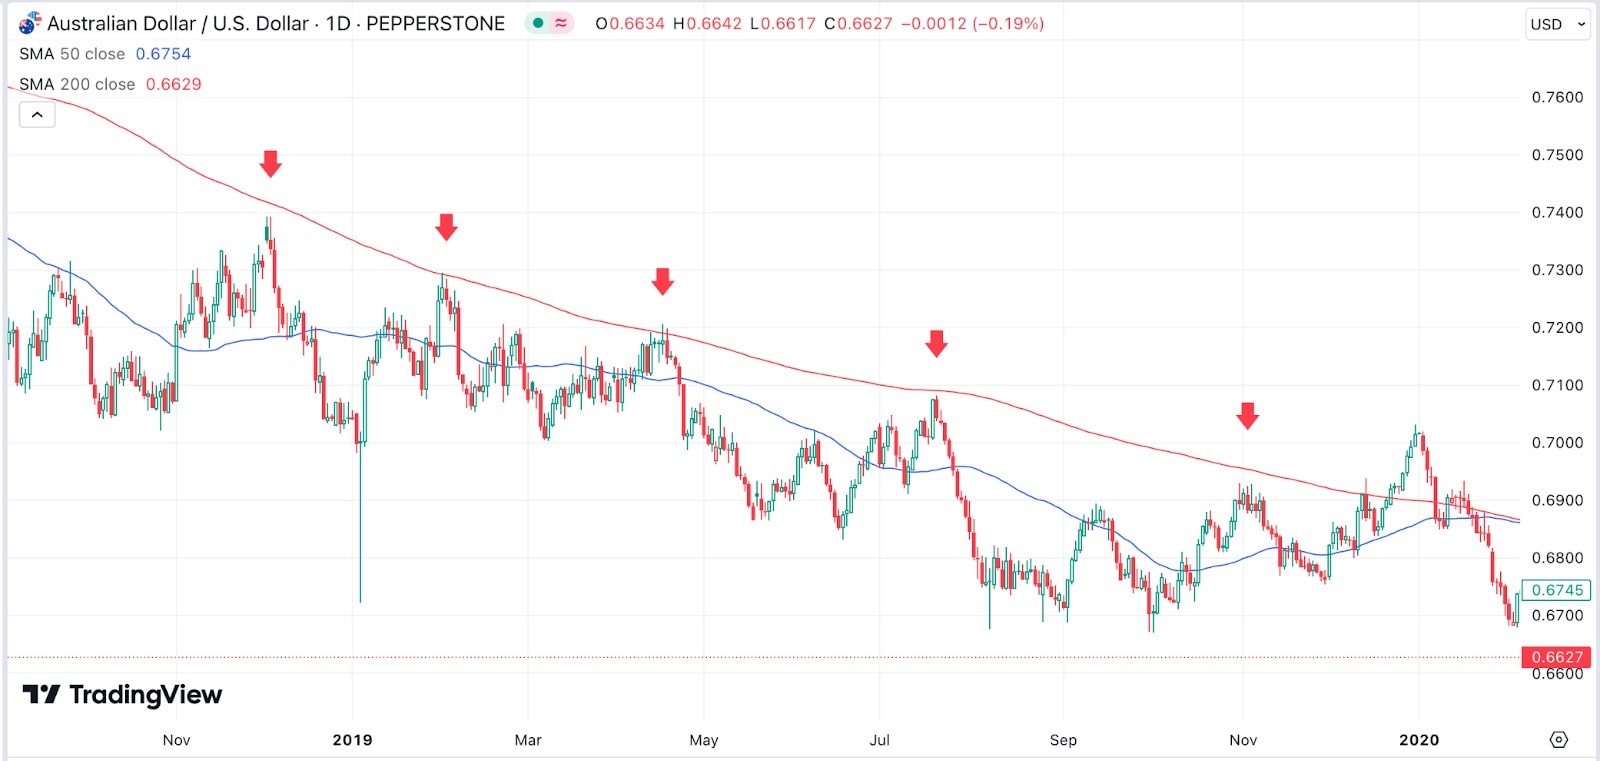
Identifying trends using moving averages
- Uptrend: When the price is above both MAs and the 50- is above the 200-day, it signals an uptrend (AUD strengthening).
- Downtrend: When the price is below both MAs and the 50- is below the 200-day, it indicates a downtrend (AUD weakening).
- Golden Cross: The 50- crossing above the 200-day signals a bullish reversal.
- Death Cross: The 50- crossing below the 200-day signals a bearish reversal.
- Support/Resistance: MAs also act as support/resistance levels during trends (chart below)
How much leverage should I use when trading AUD/USD?
Leverage allows traders to control larger positions with smaller amounts of capital, but it also increases the risk of substantial losses. Beginners should be cautious with leverage as it can amplify both gains and losses.
For beginners, 1:10 leverage is generally considered safe, meaning $10,000 can be controlled with $1,000 in capital. Intermediate traders might use leverage up to 1:30, but it’s essential to adjust risk management strategies to account for the increased exposure.
Always be aware of broker margin requirements and the risks of a margin call.
How can I start trading AUD/USD using CFDs?
Four key steps to start trading AUD/USD using CFDs:
- Open an account: Begin by opening an account with a CFD broker, such as Pepperstone, which offers a selection of trading platforms and access to AUD/USD prices.
- New traders can get to grips with the trading platform and the markets by using a demo account which simulates live market conditions and trading without the need to risk any real money.
- Fund your account: Once your trading account is open, you will need to fund it by making a deposit.
- Download the Trading Platform: Download the trading platform provided by your broker and familiarise yourself with its features and functionality.
- Start Trading: After gaining confidence in using the trading platform, you will be ready to start trading AUD/USD on your live account..
- Pepperstone trades in what are known as CFDs, or Contracts For Differences, which are cash-settled and non-deliverable. This allows you to trade long or short with equal ease, without worrying about the ownership or delivery of the underlying commodity.
What is the recommended stop-loss level when trading AUD/USD?
When trading AUD/USD, setting appropriate stop-loss levels is crucial to managing risk. The stop-loss depends on the trading strategy, time frame, and risk tolerance. However, there are some general guidelines to consider:
Volatility-Based Approach
A standard approach is to place a stop-loss 1.5 to 2 times the Average True Range (ATR) value from the entry point.
Example:
With an ATR of 0.0125 and using a 1.5 to 2 times ATR rule, set a stop-loss:
1.5 x ATR: 12.5 pips x 1.5 = 18.75 pips from the entry point
2 x ATR: 12.5 pips x 2 = 25 pips from the entry point
Support and Resistance Levels
Identify key support or resistance levels on the chart (see How Can I Use Moving Averages to Identify Trends in AUD/USD? above), and place stop-loss slightly beyond these levels. For example, if buying AUD/USD near a strong support zone, place a stop-loss a few pips below that zone to protect against breakdowns.
Percentage of Account
A common recommendation is to risk 1-2% of a trading account on a single trade. Calculate stop-loss distance by determining how much capital to risk and then size positions accordingly.
Example:
If 2% of a $10,000 account (or $200) is willing to be risked and the volatility suggests a 50-pip stop-loss, the trade would be sized so that each pip equals $4.
How can I calculate my risk-reward ratio when entering an AUD/USD trade?
The risk-reward ratio compares the potential risk of a trade to its potential reward. To calculate it:
- Determine entry point and stop-loss level (risk).
- Identify target price (reward).
- Divide the reward by the risk.
For example, if the stop-loss is 20 pips below entry and the take-profit target is 60 pips above, the risk-reward ratio is 1:3. Aim for a ratio of at least 1:2 or 1:3.
Should I trade AUD/USD around major news events, and if so, how?
Major news events like central bank announcements or economic data releases can lead to large price swings in AUD/USD. While these events create opportunities, they also carry significant risk. It's often better to wait for the initial move after an economic release rather than holding a position beforehand for a number of reasons:
- Volatility and Uncertainty: Market reaction can be unpredictable, especially when the data release differs significantly from expectations. Holding a position before the release can lead to exposure to unexpected volatility.
- Spread Widening: Around major events, brokers may widen spreads due to low liquidity, increasing trading costs. Waiting for the initial move can help avoid this.
- False Moves: Markets often experience sharp, quick moves right after a release before settling into a clear direction. By waiting, the trend can be confirmed before entering.
If trading around news, use tight stop-losses and consider reducing position size to manage volatility.
What role does China’s economy play in the movement of AUD/USD?
China is Australia’s largest trading partner, and changes in China's economic outlook, industrial demand, or policy shifts have a direct impact on Australia’s export-dependent economy. Slowing growth or decreased demand for commodities like iron ore can weaken AUD, while strong Chinese economic data tends to support AUD strength.
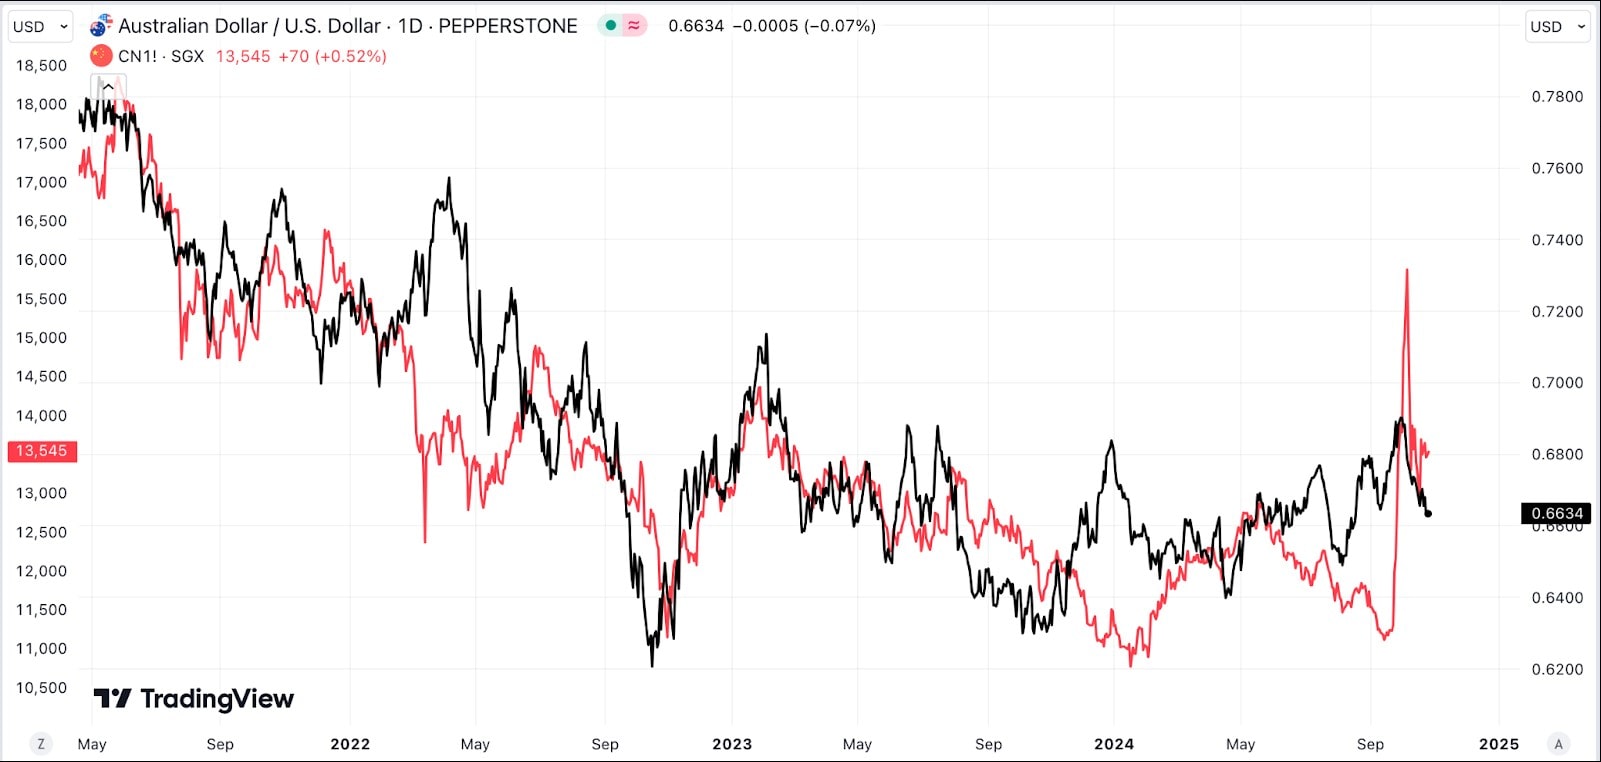
The China A50 futures index is a good proxy for AUD/USD traders (see chart above), as it reflects economic conditions in China that directly impact Australia’s exports and, by extension, the AUD. Trading the A50 on the Singapore Exchange allows investors outside of China to gain exposure to Chinese A-shares without requiring direct access to China's domestic exchanges, which have stricter capital controls and regulatory limitations. A rising A50 therefore often supports a stronger AUD, while a declining A50 can pressure the AUD lower, increasing the AUD/USD pair’s sensitivity to China’s economic performance.
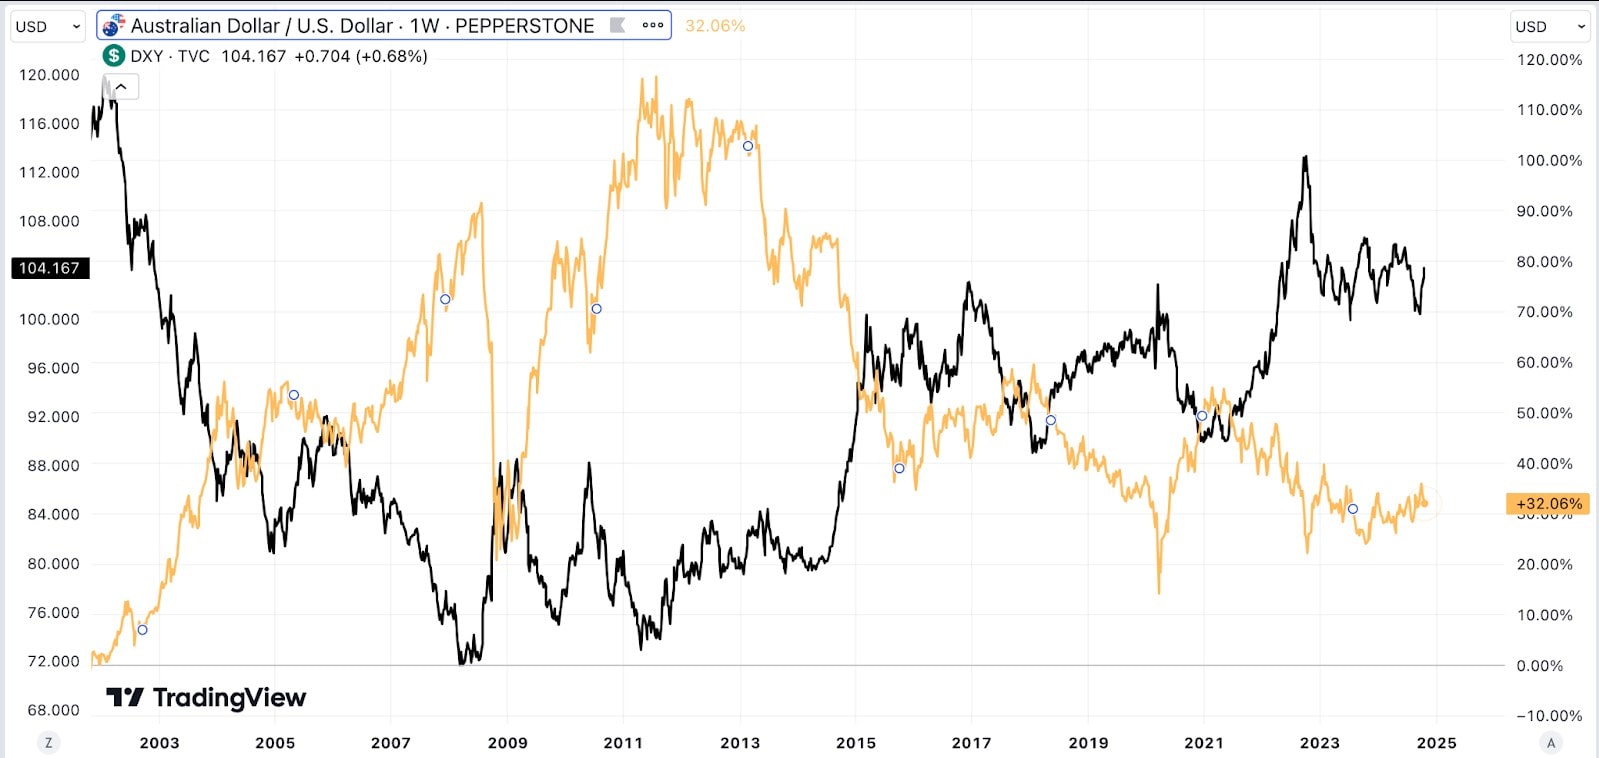
How can I use the US Dollar Index (DXY) to inform my AUD/USD trades?
The US Dollar Index (DXY) measures the USD against a basket of major currencies. A rising DXY generally indicates broad USD strength, which may weigh on AUD/USD. Tracking DXY alongside AUD/USD can help gauge overall market sentiment toward the USD and identify potential price movements. Historically, there has been a strong negative correlation between AUD/USD, often ranging from -0.7 to -0.9 depending on market conditions but this relationship is not perfect and can vary based on other factors like interest rates, commodity prices, and central bank policies:
The material provided here has not been prepared in accordance with legal requirements designed to promote the independence of investment research and as such is considered to be a marketing communication. Whilst it is not subject to any prohibition on dealing ahead of the dissemination of investment research we will not seek to take any advantage before providing it to our clients.
Pepperstone doesn’t represent that the material provided here is accurate, current or complete, and therefore shouldn’t be relied upon as such. The information, whether from a third party or not, isn’t to be considered as a recommendation; or an offer to buy or sell; or the solicitation of an offer to buy or sell any security, financial product or instrument; or to participate in any particular trading strategy. It does not take into account readers’ financial situation or investment objectives. We advise any readers of this content to seek their own advice. Without the approval of Pepperstone, reproduction or redistribution of this information isn’t permitted.