- English
- 中文版
Inverted US yield curve – should FX traders be worried?
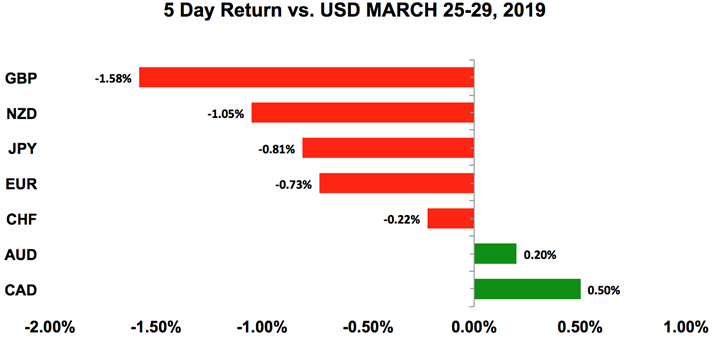
The greenback also hit multi-month lows versus the euro but lost value against sterling, the Australian, New Zealand and Canadian dollars. A lot has happened over the past three months. Growth is slowing across the globe, bond yields are crashing and central bankers are talking about the need for fewer rate hikes and more stimulus. In the US, an inverted yield curve sparks fears of a recession and in Europe, with no end in sight, investors are still waiting to see the next twist in the Brexit drama. These concerns should haunt the financial markets throughout the second quarter and for the FX market specifically, there will be a tug of war between risk appetite and central bank policy. Looking ahead, the second quarter kicks off with a very busy economic calendar. There’s a Reserve Bank of Australia monetary policy meeting along with a number of important US, UK, Australian and Canadian economic reports. This means that not only should we expect big moves in the AUD, but greater volatility for all of the major currencies.
Weekly Trade Ideas: Don't miss these market moving opportunities identified by BK Forex.
US DOLLAR
Data Review
- Housing Starts 1162K vs. 1210K Expected
- Building Permits 1296K vs. 1305K Expected
- S&P Case Shiller House Price Index 0.11% vs. 0.3% Expected
- Richmond Fed Index 10 vs. 10 Expected
- Conference Board Consumer Confidence Index 124.1 vs. 132.5 Expected
- Trade Balance -$51.1B vs. -$57B
- Current account balance -134.4B vs. -130B Expected
- Q4 GDP Revision 2.2% vs. 2.3% Expected
- Personal Consumption 2.5% vs. 2.6% Expected
- Jobless Claims 211K vs. 220K Expected
- Pending Home Sales -1% vs. -0.5% Expected
- Personal Income 0.2% vs. 0.3% Expected
- Personal Spending 0.1% vs. 0.3% Expected
- New Home Sales 667K vs. 620K Expected
- University of Michigan Sentiment Index 98.4 vs. 97.8 Expected
Data Preview
- Retail Sales – Potential upside surprise as gas prices and wages grow strongly in February
- Durable Goods - Durable goods orders are difficult to predict but Boeing orders will certainly be affected by the 2 crashes
- ADP – The private employment report is likely to pull back after diverging so significantly from last month’s NFP
- ISM Manufacturing
- ISM Non-Manufacturing – Will have to see how the manufacturing report fares but slowdown likely given last month’s big NFP miss
- Non-farm payrolls - Job growth should rebound after last month’s big downside surprise
Key Levels
- Support 110.00
- Resistance 112.00
Inverted US yield curve – Should dollar bulls be worried?
The biggest story in the financial markets right now is the inverted US yield curve. For the first time since 2007, the yield on the 10-year Treasury note is lower than the yield on 3-month paper and this has investors very worried. The US economy fell into recession 7 times in the last 5 decades and the yield curve inverted before all but one. The reason why yield curve inversion is such an accurate determinant for recessions is because when short term rates exceed long time rates, investors are worried about the near-term outlook for the economy and want more compensation for tying up their money during this time. The stock market tends to peak in advance with bear markets coinciding with recessions.
Should you be worried? NO, in the short term. YES, in the long run.
Throughout the past week, FX traders were yanked around by risk on / risk off flows because investors are having a hard time deciding whether the drop in yields is positive or negative for stocks. On the one hand, lower rates are good for borrowing but on the other, the yield curve inverted as a result of falling interest rates and central bank pessimism. In the past month, every major central bank raised concerns about domestic or global growth and bond traders are finally hearing what they have to say. Equity traders, on the other hand, are still largely ignoring these warnings as US stocks spend the past month hovering near 3-month highs. The mixed performance of the US dollar is a sign that forex traders are not sure what’s more important – risk aversion or US recession. In the short run, there’s no need for panic because there’s generally a long 12+ month lag between the yield curve inversion and a recession. While the stats are all over the place, on average in the past 60 years, during which there were 9 yield curve inversions, the stock market generally does not peak until 8 months later. This means stocks could hold onto their gains in the near term until the deterioration in the economy becomes more evident. Also, the yield curve can invert, normalise and invert again as it has many times in the past.
In the long run, the historical ramifications of a yield curve inversion are consistent with the Fed and ECB’s warnings of slower growth. There’s a very good chance of a recession in 2020 or 2021. But like stocks, a yield curve inversion is not always negative for the US dollar. The last time the 3-month rate exceeded the 10-year rate was in 2008 and that was right before the Dollar Index soared on risk aversion. Before that in 2006, the dollar fell at the initial inversion but recovered quickly. The same was true in 2000, the dollar index consolidated and then popped higher.
While a yield curve inversion could actually help the dollar, in the near term, the focus will be on Fed monetary policy and whether the economy is really slowing enough to justify the central bank’s decision to cut their interest rate forecast to zero for the rest of the year. How fast the greenback falls will hinge on the upcoming retail sales, ISM and nonfarm payrolls reports. If spending, economic activity and job growth is weak, USDJPY will extend its slide quickly. However, if these reports improve from the prior month, we could see a relief rally.
AUD, NZD, CAD
Data Review
Australia
- No data
New Zealand
- RBNZ says the risk of a rate cut greater than a hike
- Trade Balance 12M vs. -200M Expected
- ANZ Activity Outlook 6.3 vs. 10.5 Previous
- ANZ Business Confidence -38 vs. -30.9 Previous
- ANZ Consumer Confidence 0.8% vs. -0.7% Previous
- Building Permits 1.9% vs. 16.5% Previous
Canada
- Trade Balance -4.25B vs. -3.55B Expected
- GDP MoM 0.3% vs. 0.1% Expected
- GDP YoY 1.6% vs. 1.3% Expected
Data Preview
Australia
- RBA Rate Decision – No changes expected from the RBA but investors will be watching for any cautiousness
- AU PMI Manufacturing – Likely to be weaker given slowdown in China’s economy
- AU Retail Sales, Trade Balance & PMI Services – Potential downside surprise given a general weakness in global growth and China
New Zealand
- None
Canada
- IVEY PMI – Possible rebound after last month’s soft read
- Employment report – Likely to be weaker after 2 strong months
Key Levels
- Support AUD .7000 NZD .6700 CAD 1.3200
- Resistance AUD .7200 NZD .6900 CAD 1.3450
Will AUD Break Down on RBA?
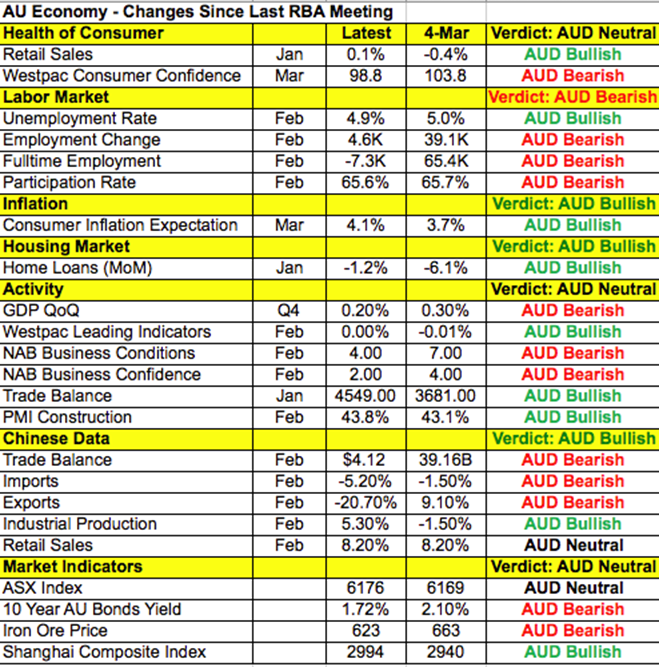
Investors are bailing out commodity currencies as concern about global growth grows. These smaller economies are generally more sensitive to a slowdown abroad when their largest trading partners are affected. This past week, we learned that Chinese industrial profits dropped 14% and a decline as large as this could trigger additional stimulus from the central bank. But tax cuts in China go in effect this week and the government may want to see how much they lift the economy before doing more. The Reserve Bank of Australia who has a monetary policy meeting on Tuesday could share this sentiment. Although the Reserve Bank of New Zealand talked easing this past week, the RBA should still reiterate that the next rate move will be up not down. Since February, we’ve seen inflation expectations rise, consumer spending recover and the unemployment rate drop to its lowest level since 2011. These improvements help to offset the decline in business and consumer confidence as well as the deterioration in Chinese trade. So while risk appetite could keep AUD down, the RBA rate decision may help more than hurt the currency. Aside from the monetary policy announcement, we also have retail sales, the trade balance, manufacturing and service sector PMIs scheduled for release. Technically, the pair is range bound with a negative bias and that will remain the case until it breaks above .7150.
The New Zealand dollar, on the other hand, could trade much lower. Last Wednesday, NZDUSD experienced its strongest one day decline in 7 weeks on the back of the Reserve Bank’s monetary policy announcement. The last time NZDUSD dropped this much was when the unemployment rate rose much more than expected. This time, the RBNZ surprised everyone by saying a rate cut is more likely now than a hike as the balance of risks shifted to the downside due to lower business sentiment and a more pronounced global downturn. This is a major departure for Governor Orr who just last month said the chance of easing did not increase despite recent downgrades to growth. Having broken below a number of important technical levels, the next stop for NZDUSD should be the March low near .6750. USDCAD is closing in on 2-month highs despite a recovery in oil prices. While the price of crude is hovering near 5-month highs investors are more worried about how the slowdown in US growth could affect Canada. After ballooning in December, the trade deficit saw very little improvement in January. GDP growth rebounded but it was not enough to ease the market’s concern that a possible recession in the US will hit Canada hard. This week will also be an important one for CAD with the country’s IVEY PMI and employment reports scheduled for release.
BRITISH POUND
Data Review
- CBI Distributive Sales Survey -18 vs. 4 Expected
- GfK Confidence -13 vs. -14 Expected
- Nationwide House Prices 0.2% vs. 0% Expected
- Mortgage Approvals 64.3K vs. 65K Expected
- Q4 GDP 0.2% vs. 0.2% Expected
- Current Account Balance -23.7B vs. -22.9B Expected
Data Preview
- UK PMI Manufacturing – Potential downside surprise given the sharp drop in CBI
- UK PMI Services – Have to see how manufacturing sector fares but growth should remain weak given Brexit uncertainty
Key Levels
- Support 1.2800
- Resistance 1.3300
In a last ditch effort to test the temperature of Parliament after her offer to resign if her Brexit deal is approved, Prime Minister May faced another crushing defeat when members of Parliament struck down her agreement by a vote of 334 vs. 286. The UK has until April 11th to come up with another plan or be forced to leave the European Union with no agreement – a scenario that could send the UK economy and currency in a downward spiral. The EU isn’t optimistic – they feel “No-deal” scenario on 12 April is now a likely scenario. The EU has been preparing for this since 12/2017. Now fully prepared. We will remain united. Benefits of WA, including a transition period, will not be replicated in the “no-deal” scenario. Sectoral mini-deals are not an option.” European Council President Donald called an emergency leaders summit on April 10th to discuss any requests by the UK. The EU has some contingency measures planned to maintain continuity for 6-9 months but beyond that, there are no guarantees. There are only 3 potential outcomes at this stage – the UK leaves the EU with no deal, May steps down and the UK asks for a longer extension citing her departure as a game changer or May bows down to the EU and requests for the delay herself. The most likely scenario is one that involves her resignation and if that’s the option chosen we could see a relief rally in GBP. Brexit will remain a leading driver of sterling this week but UK data will also be in focus. The PMIs are scheduled for release and improvements are unlikely given ongoing Brexit uncertainty.
EURO
Data Review
- German IFO Business Climate 99.6 vs. 98.5 Expected
- German IFO Expectations 95.6 vs. 94 Expected
- German IFO Current Assessment 103.8 vs. 102.9 Expected
- German GfK confidence 10.4 vs. 10.8 Expected
- German CPI MoM 0.4% vs. 0.6% Expected
- German CPI YoY 1.3% vs. 1.5% Expected
- EZ Business Confidence 105.5 vs. 105.9 Expected
- EZ Industrial Confidence -1.7 vs. -0.6 Expected
- German Retail Sales 0.9% vs. -1% Expected
- German Unemployment Change -7K vs. -10K Expected
- German Unemployment Rate 4.9% vs. 4.9% Expected
Data Preview
- EZ CPI and Unemployment – Potential downside surprise given a weaker German growth
- EZ PPI – Potential downside surprise given a weaker German CPI and PPI
- Eurozone Retail Sales
- German Industrial Production – Will have to see how factory orders fare
Key Levels
- Support 1.1200
- Resistance 1.1400
German Yields Turn Negative – Euro Headed for 1.10?
Yields are also falling in Europe. Over the past week, German 10-year bund yields dropped to a 2.5 year low, turning negative for the first time since 2016. This is very bearish for the currency but the slide in euro was tempered by the contemporaneous decline in US Treasury yields. With negative interest rates, the euro should be trading at 1.10 and not 1.12 but with 10-year bund yields so low the yield spread is actually moving in favour of the EURUSD and slowing the decline. The pair is still falling and it shouldn’t be long before this support level is reached. EURJPY is also likely to fall further as German 10-year bund yields dropped below Japanese JGB yields of the same maturity for the first time since 2016. Although a fresh 2-month low was reached this past week, we are looking for EURJPY to drop to 123 and possibly even 122. Meanwhile, Eurozone data has been mixed. German business confidence improved slightly but Eurozone confidence declined and inflationary pressures eased. Looking at this week’s calendar, there are fewer market moving releases for the euro than the dollar, so the pair is likely to take its cue from the market’s reaction to US data.
Ready to trade?
It's quick and easy to get started. Apply in minutes with our simple application process.
The material provided here has not been prepared in accordance with legal requirements designed to promote the independence of investment research and as such is considered to be a marketing communication. Whilst it is not subject to any prohibition on dealing ahead of the dissemination of investment research we will not seek to take any advantage before providing it to our clients.
Pepperstone doesn’t represent that the material provided here is accurate, current or complete, and therefore shouldn’t be relied upon as such. The information, whether from a third party or not, isn’t to be considered as a recommendation; or an offer to buy or sell; or the solicitation of an offer to buy or sell any security, financial product or instrument; or to participate in any particular trading strategy. It does not take into account readers’ financial situation or investment objectives. We advise any readers of this content to seek their own advice. Without the approval of Pepperstone, reproduction or redistribution of this information isn’t permitted.