- English
- 中文版

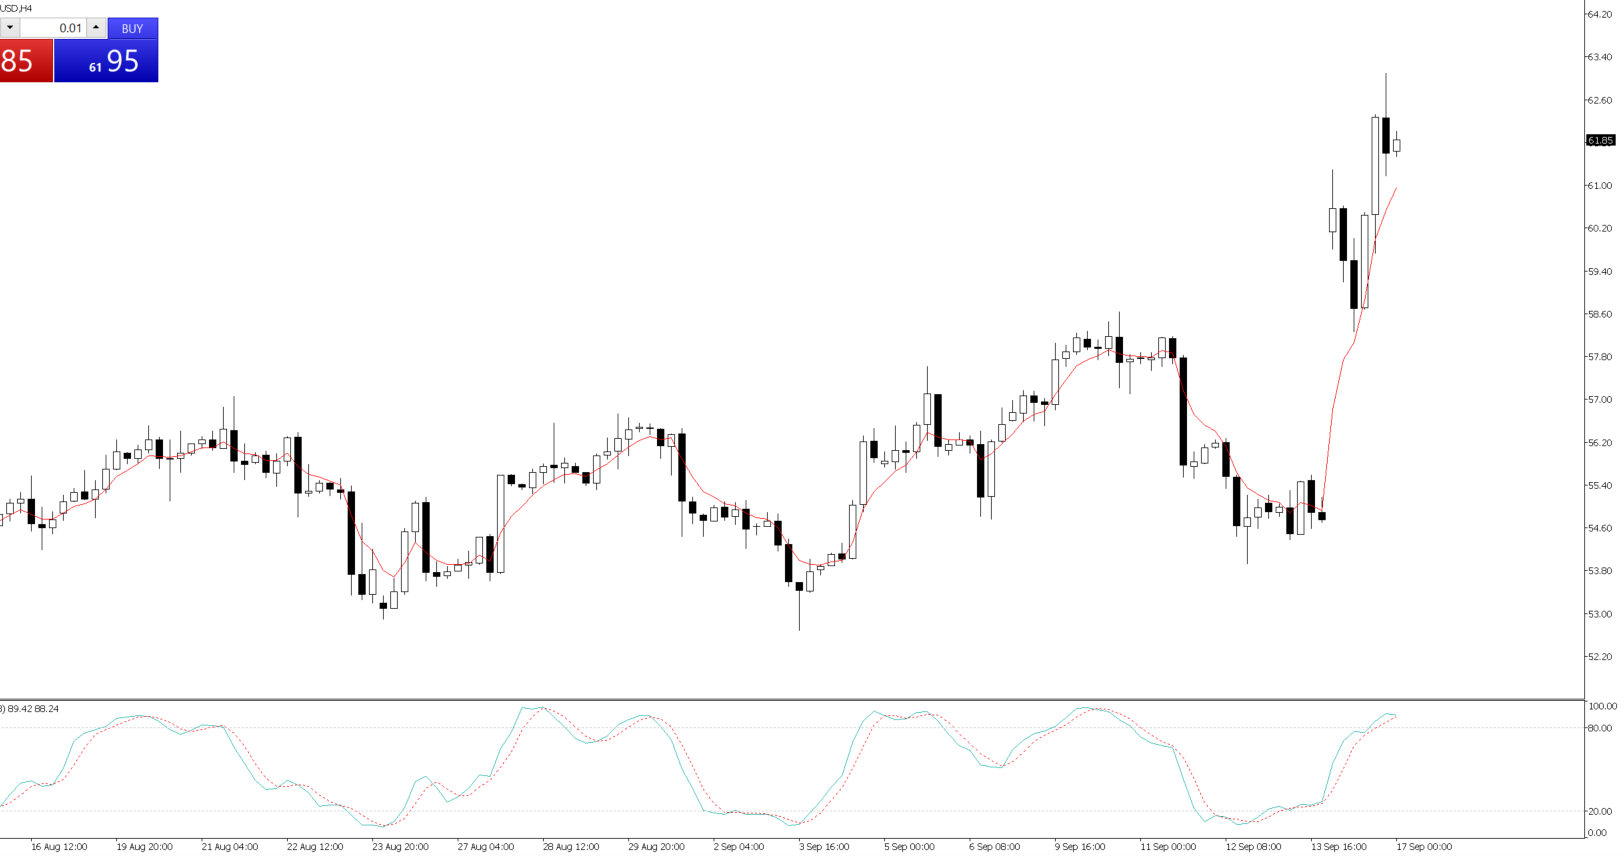
Headlines that say “Aramco said to face weeks without the majority of Abqaiq output” has been at the backbone of the bull move. But also keeping a bid in the market is certainly the notion that further attacks on the facility could come at any time, not to mention a rising premium that this war of words could escalate into something more sinister. The situation remains fluid, and this holds huge considerations for traders holding oil exposures and who like to sleep.
Four-hour chart of WTI crude
Naturally, sector one would expect the ASX 200 energy will build on the 4% gain we saw yesterday (the best day since 3 December 2018), with the S&P 500 energy sector putting on 3.3% as a guide. Airlines will continue to face headwinds, although the broader move in Asian indices should be supported, with S&P 500 futures up 0.3% from the ASX 200 close.
That said, Aussie SPI futures are -11p lower from the ASX 200 close, and Nikkei 225 futures are 0.1% lower. At this stage, the Asia open looks to be a calm affair. In terms of price catalysts, traders will contend with the Reserve Bank of Australia September meeting minutes and Aussie Q2 house price index. Also, as we head into European trade (7 pm AEST) we get the German ZEW survey, while in the US we see industrial production. Given the current crosscurrents in markets, it doesn’t feel like any of these will give new information that changes the macro focus, so I’d have limited concerns about holding positions over these risks.
So, what did we take out of the session?
The moves in oil have naturally resonated in markets. If we look at the FX plays, granted we’ve seen the NOK and CAD outperform in G10 FX, as have the RUB and KRW (in emerging markets), the better play, however, has been to sell these against the crosses (such as EUR) and not against the USD. Long NOKINR (India rupee) has been the play of the day, although we’ve seen selling in ZAR, with traders tactically looking at the big net importers of crude and looking at the negative impact higher crude has on its current account and GDP.
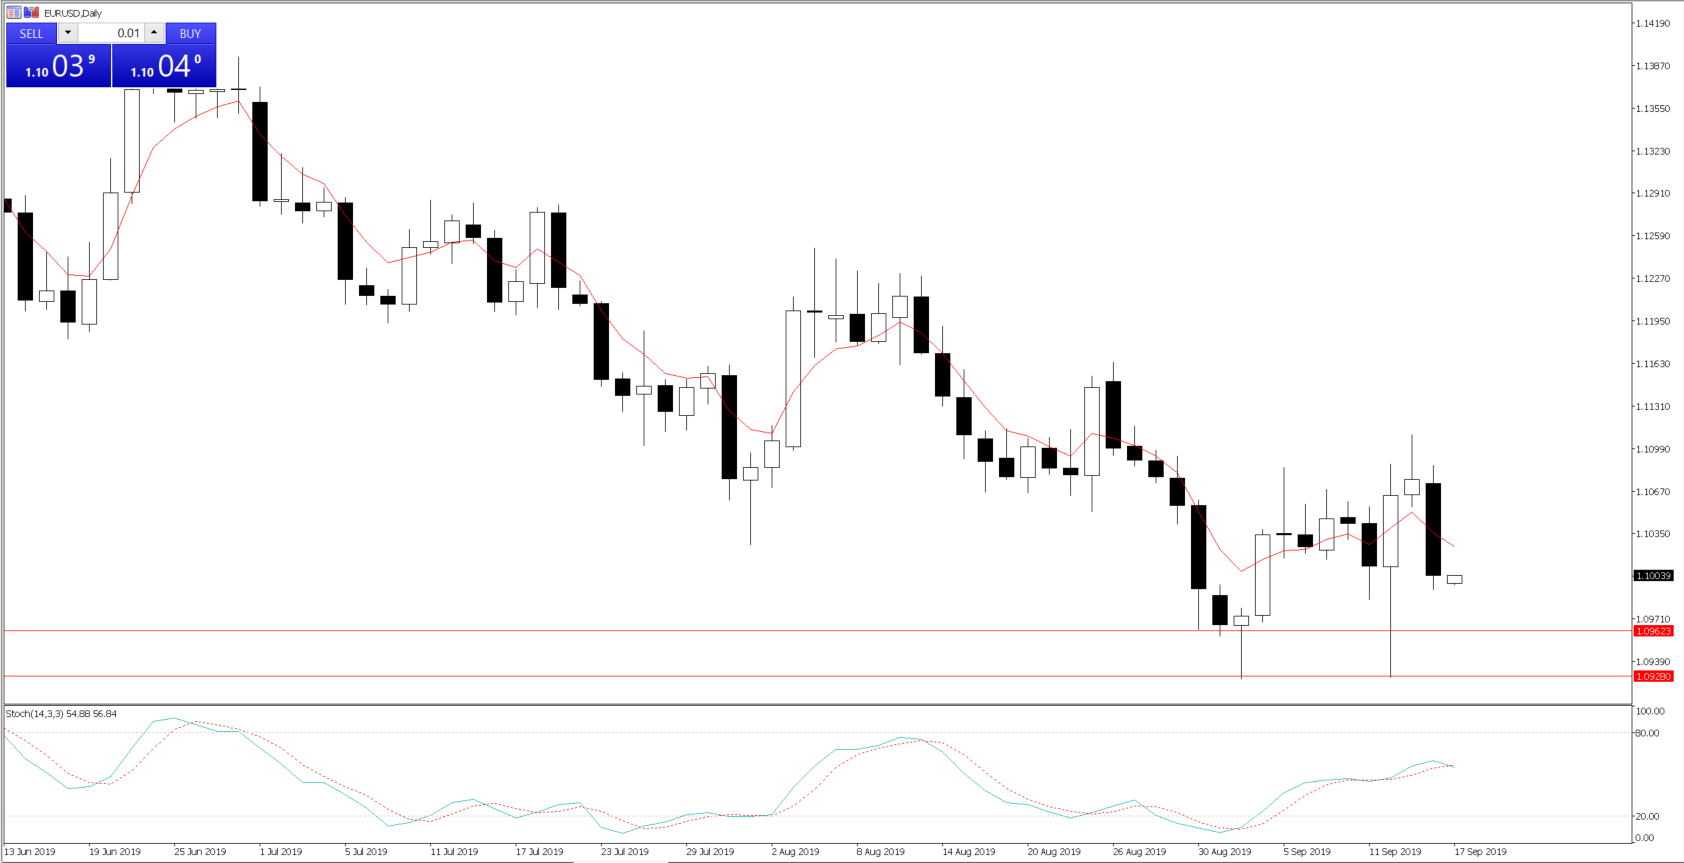
The USD index has put on 0.4%. Granted the US is a net exporter of crude, there are other, more mysterious forces at work here. Notably, the buying has played out against the EUR, with EURUSD offered all through European trade and moving from 1.1080 into 1.0994. On the daily chart we’ve seen solid buying below the 2 September low of 1.0958, so a retest here will be interesting to see if we see similar bids return this time around. We can look at EURUSD two-week risk reversals, which focus on the difference between put and call volatility and see this sits at -0.01. This tells me options traders see the near-term risks to price over the coming two weeks as symmetrical, and the demand for put optionality is equal to that of calls.
EURUSD daily chart
What’s been driving the USD?
The USD has its eyes on this week’s FOMC meeting (Thursday at 4 am AEST). The geopolitical news flow will also only cement expectations of a cut this week, where the implied probability of a cut continues to hold 100%. In fact, we’ve also seen a slight response in Fed funds future further out the curve, with buying in the January contract, resulting in a 4bp decline to 1.63%. This signals increased expectations of two rate cuts through to the December FOMC meeting, with 50.5bp of cuts now priced for this year (that includes this week). One could argue this as a USD negative.
We can also see the response to shy away from risk has seen a reasonable move in the US bond market, with a move of 5bp lower seen across the curve. Given we’ve seen US inflation expectations hold firm, we can see “real” (inflation-adjusted) yields moving lower. Again, this could be construed as a headwind for the USD.
So, why has the USD held in so firm?
In fact, the idea that USDJPY has held the 108 handle is testament to the moves seen in the FX funding channels and the demand for USDs. We can immediately turn to the three-month FRA/OIS spread (3m libor vs overnight index swaps), which moved up an impressive 14bp to settle at 45bp (see below) — which we can take as a sign of increased USD demand. This has resonated in EURUSD cross-currency basis, with EURUSD basis swaps falling a sizable 9bp.
There are some interesting things going on behind the scenes involving Q3 US corporate tax day, which suggests a large number of USDs have been drained from the system. But traders are also talking about concerns around year-end funding. From a simplistic situation, however, we see USD liquidity dry up and demand for USDs increasing, and the USD has eyed the funding markets.
Whether this stress lasts is yet to be seen. One suspects it’ll need to be offset by the Federal Reserve this week, which may alter the interest it pays on banks’ excess reserves.
Ready to trade?
It's quick and easy to get started. Apply in minutes with our simple application process.
The material provided here has not been prepared in accordance with legal requirements designed to promote the independence of investment research and as such is considered to be a marketing communication. Whilst it is not subject to any prohibition on dealing ahead of the dissemination of investment research we will not seek to take any advantage before providing it to our clients.
Pepperstone doesn’t represent that the material provided here is accurate, current or complete, and therefore shouldn’t be relied upon as such. The information, whether from a third party or not, isn’t to be considered as a recommendation; or an offer to buy or sell; or the solicitation of an offer to buy or sell any security, financial product or instrument; or to participate in any particular trading strategy. It does not take into account readers’ financial situation or investment objectives. We advise any readers of this content to seek their own advice. Without the approval of Pepperstone, reproduction or redistribution of this information isn’t permitted.