- English
- 中文版
Daily Fix: Assessing the true quality of the rally in US equities
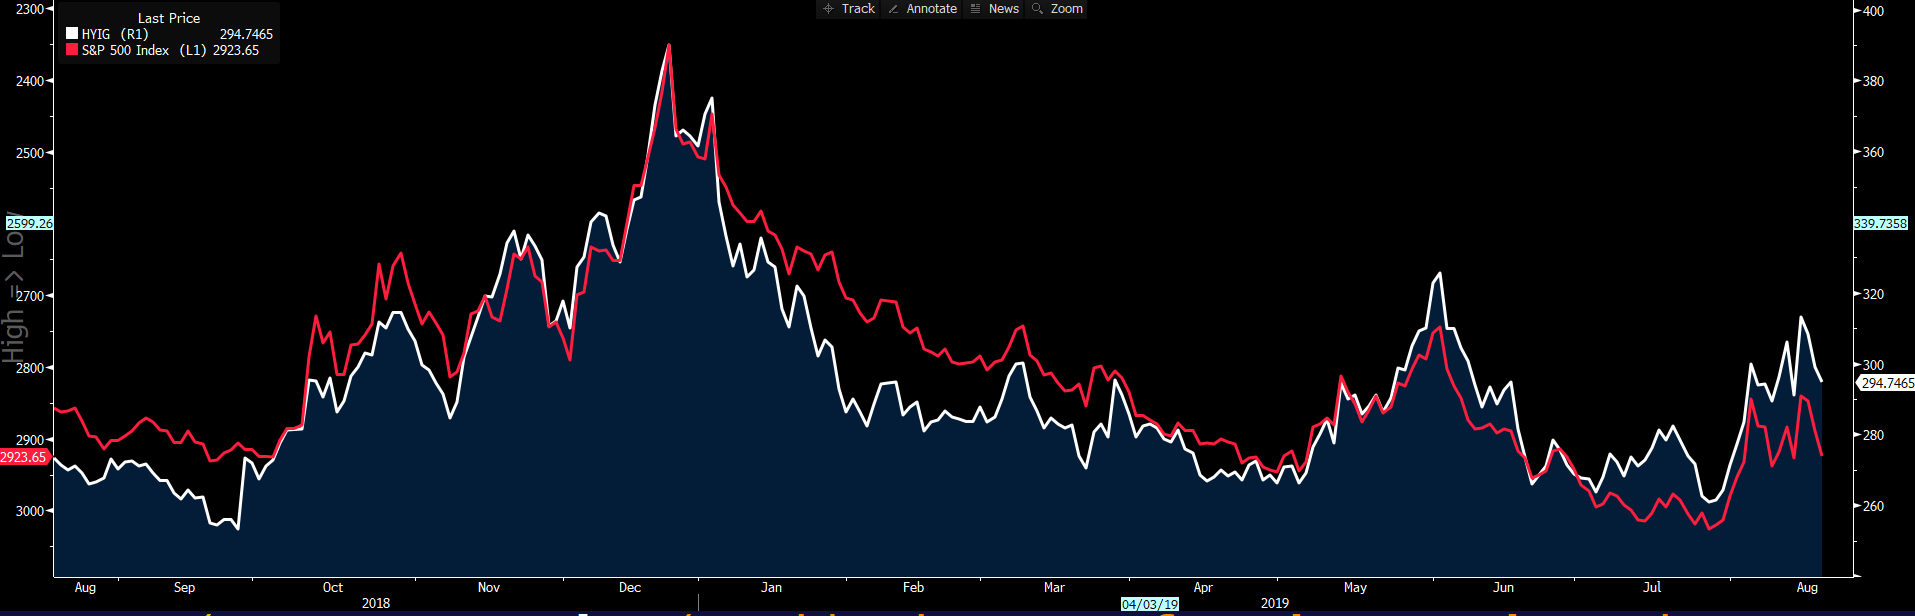
Three indicators I look to to assess the overall feel of the world’s most liquid equity index are the S&P 500 cyclical / defensive sector ratio, S&P500 high beta / low volatility ratio, and small-cap/large-cap ratio. Like many others, I also focus on credit, notably the high yield to investment-grade credit spread (white), which narrowed 3.9bp on the day to 295bp. Here, I’ve overlapped the spread to the S&P500 (red), which I’ve also inverted to better highlight the relationship. And we see stocks have outflanked credit.
S&P 500 cyclical / defensive sector ratio
"Source: Bloomberg"
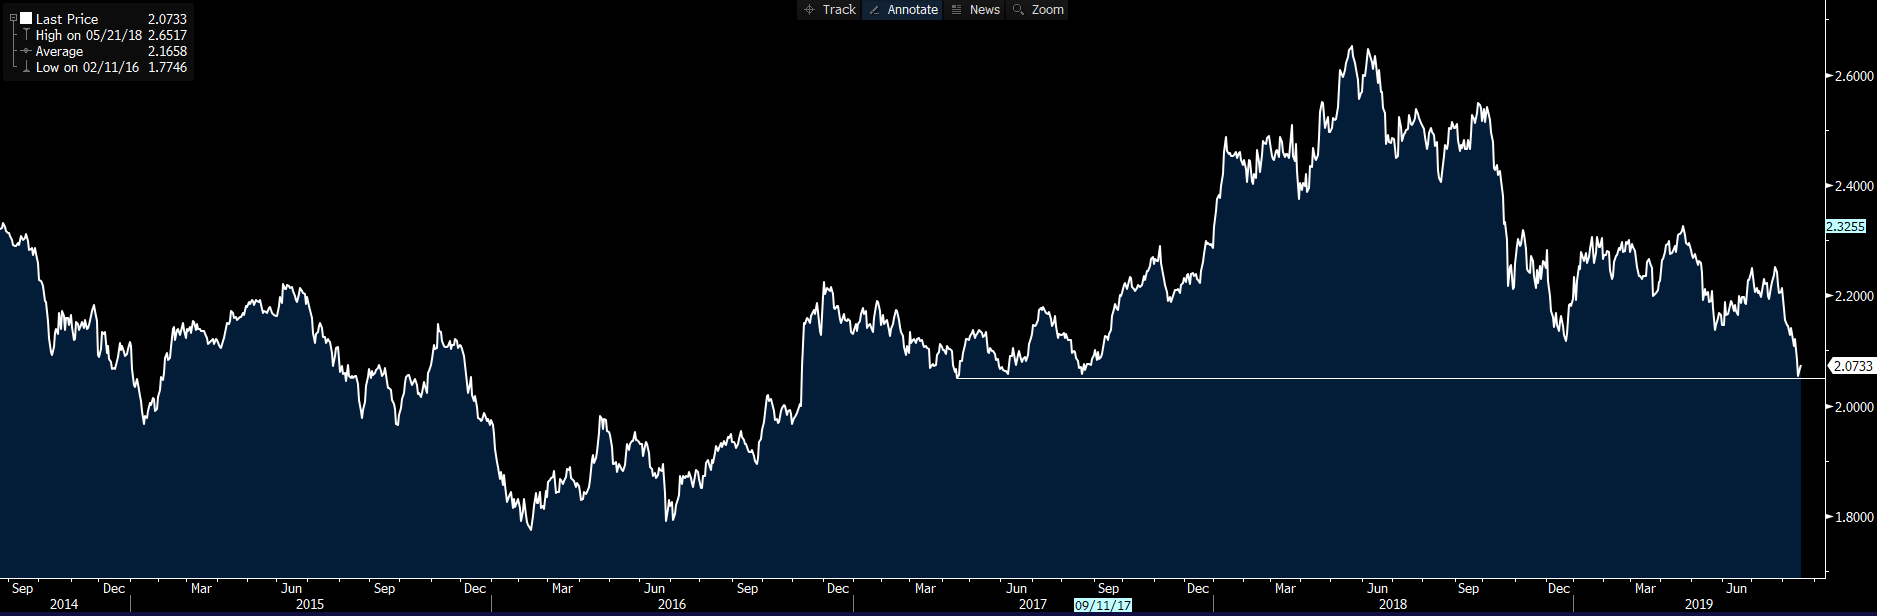
S&P 500 cyclical / defensive sector ratio: We saw this ratio close up a touch. But it was unconvincing and has been working so heavily in favour of defensive areas of the market. The setup looks like a sizable head-and-shoulders reversal pattern. I still favour this lower.
High beta/low volatility ratio
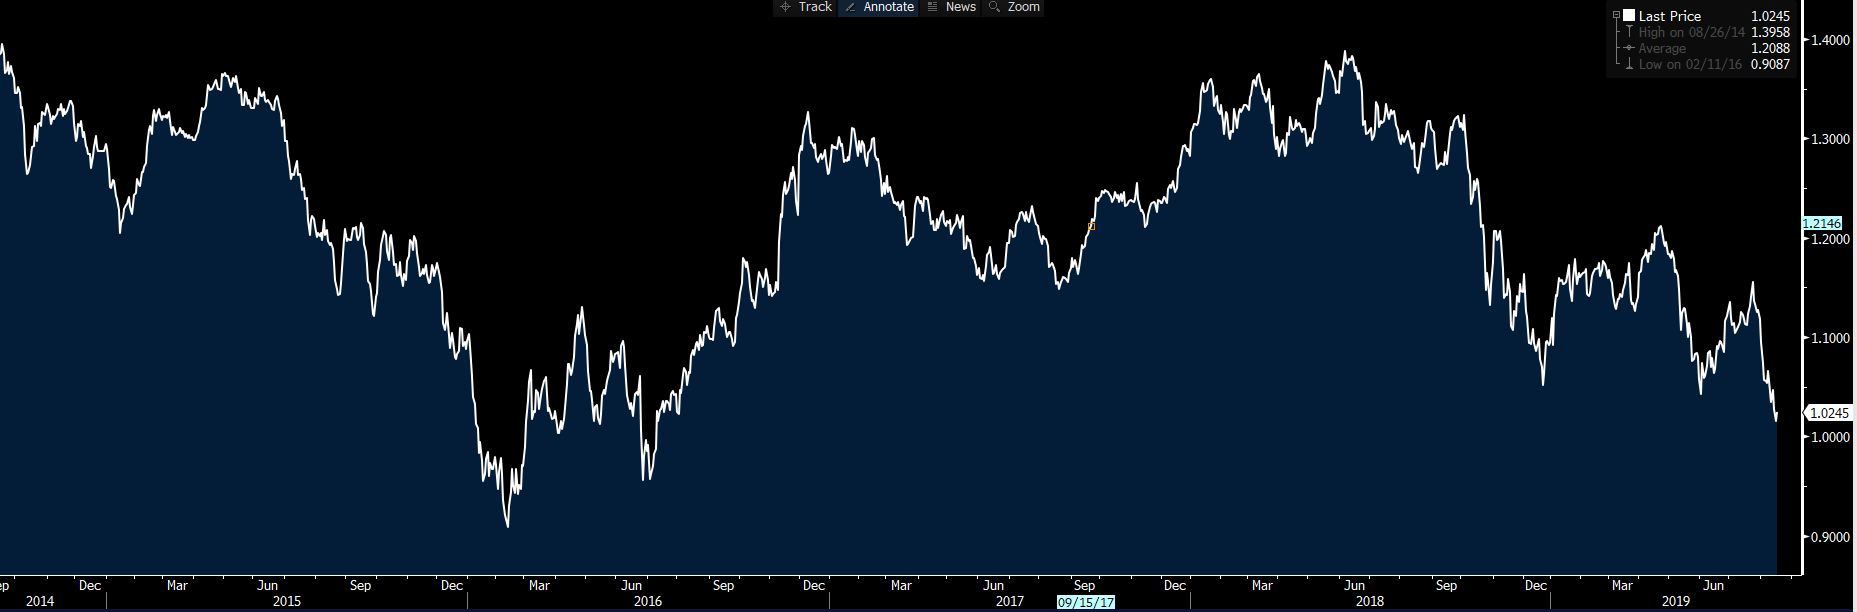
High beta/low volatility ratio: The ratio lifted from 1.0149x to 1.0245x, showing high-beta names outperforming stocks that tend to have lower volatility moves. A close play on the cyclical / defensive sector ratio — although this chart is more defined, as well as a closer play on the price characteristics of the companies and their historic moves relative to the benchmark (S&P 500).
Small-cap (Russell 2000) / Large-cap (S&P 500) ratio
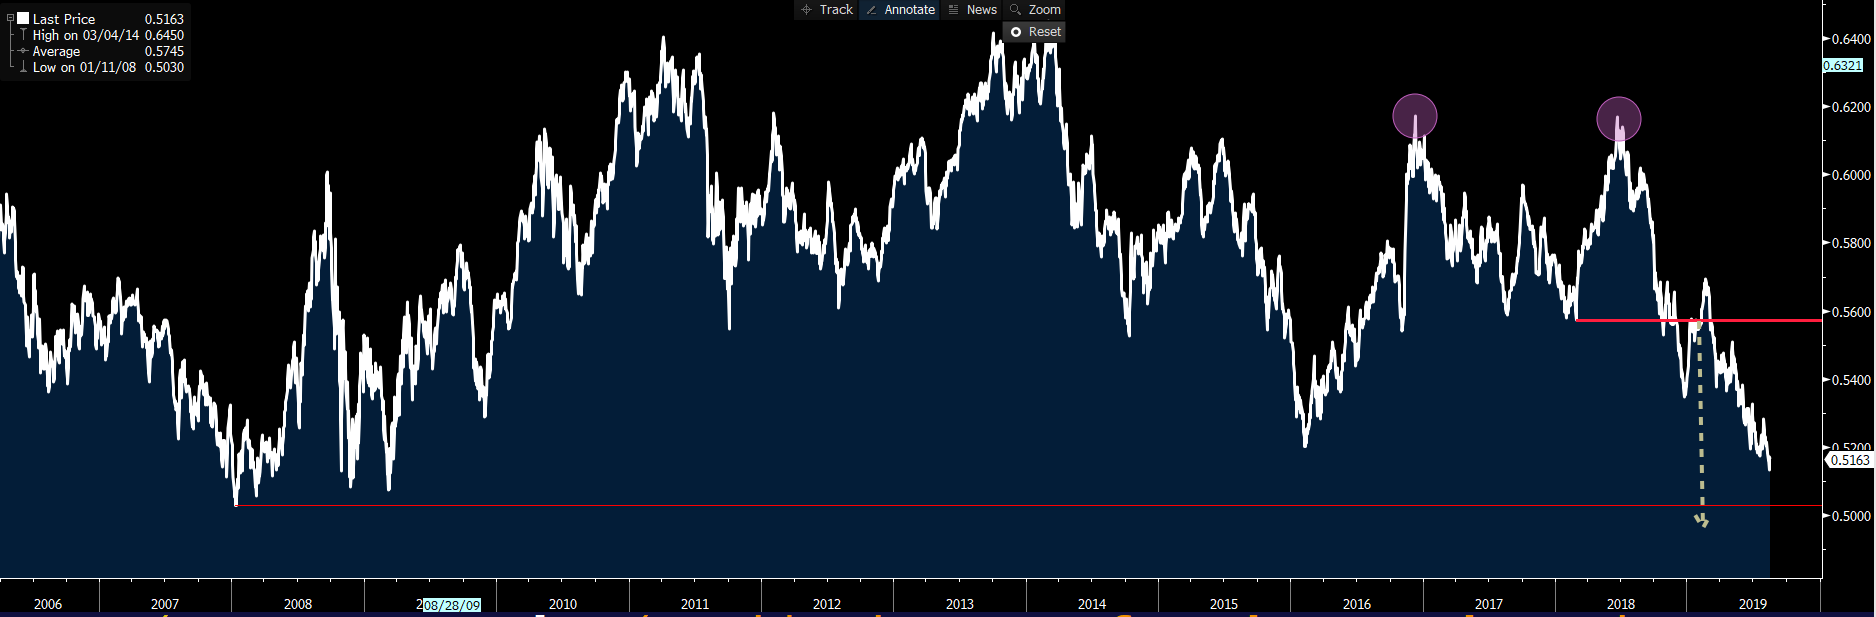
Small-cap (Russell 2000) / Large-cap (S&P 500) ratio: With the Russell 2000 closing +1.02%, and S&P 500 +1.2, we saw the ratio close down a touch. In a truly bullish move, we’d want to see small caps having the bigger percentage move here. To be fair, there’s incredible momentum here anyhow, and has been a solid pairs trade for traders. Being long the S&P500 and short Russell 2000 has been working like a dream since July.
So, while there’s been a positive move in stocks, I remain unconvinced here given these factors mentioned above. The bulls will have an eye on the daily chart of the S&P 500, and will want to see a move through 2950, which takes price through the 50-day moving average and the top of its recent range. On the weekly chart, we see stochastic momentum still headed lower, with some solid buying support into 2822/25. Until these levels are taken out, it's hard to feel the markets have a role in driving the Federal Reserve to steepen the yield curve by getting fully ahead of market pricing.
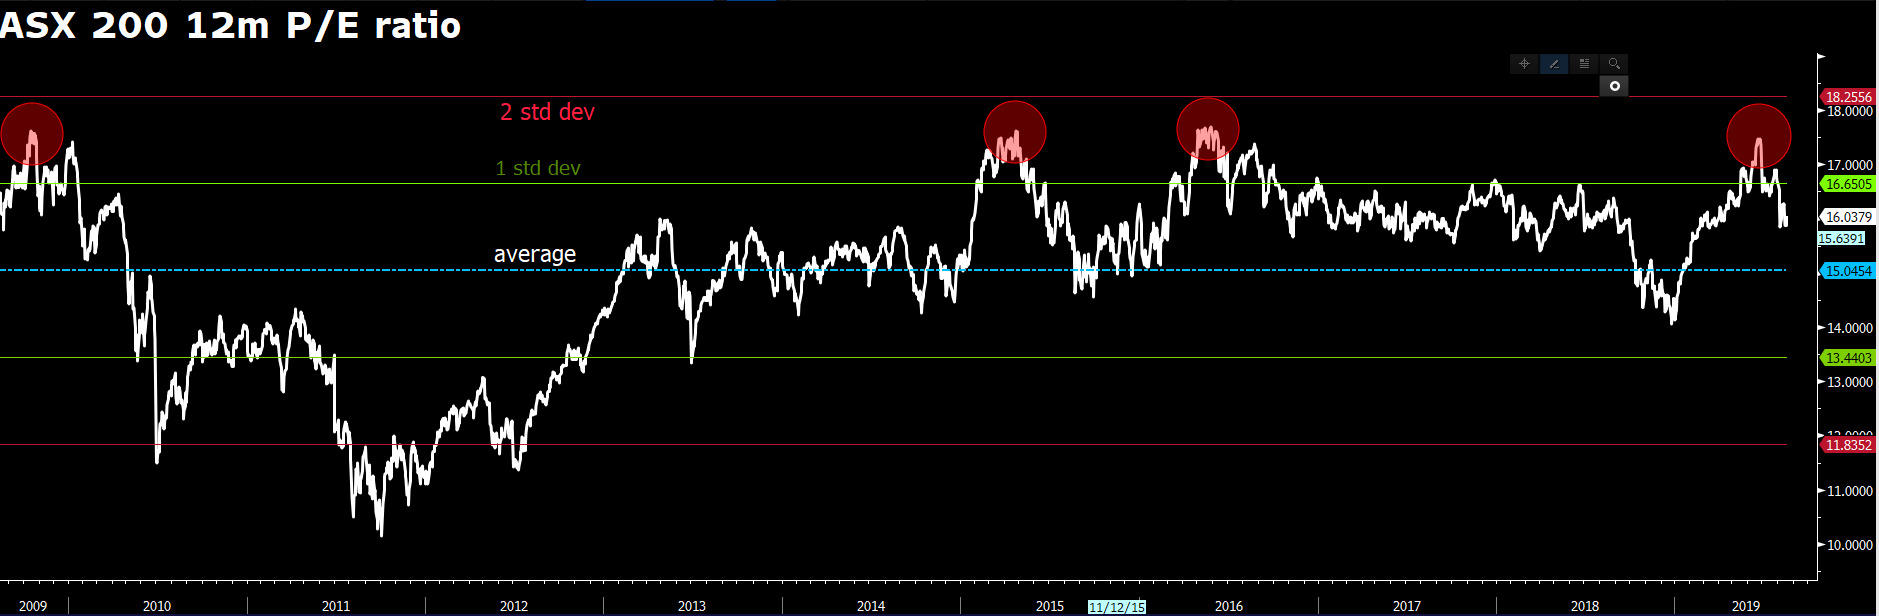
What’s key for us here in Asia is what’s already discounted given the moves in S&P 500 futures and, therefore, how it affects our open. If we look at the change in the S&P500 futures from 16:10 AEST (the official ASX200 close), we can see a +0.4% change in futures. So, it’s clear some of the positive moves in the cash session were already priced into Asian markets. Aussie SPI futures were trading at 6420 around 16:10 AEST, and currently reside at 6440. We thus can feasibly see the ASX 200 opening 20p higher (or +0.4%). Looking at the daily chart of the ASX200, it feels an elevated risk that we’re grinding out a trading range of 6600 to 6400 for the near term.
Valuations are far more reasonable at a 12m P/E of 16.03x — closer to the 10-year average of 15.04x, and now less than one standard deviation from the long-term average.
Energy should work well, with WTI crude sitting up 1.5% since the ASX200 close. Iron ore sits +1.1% since 16:10 AEST, while copper stays unchanged at US$2.60 p/lb.
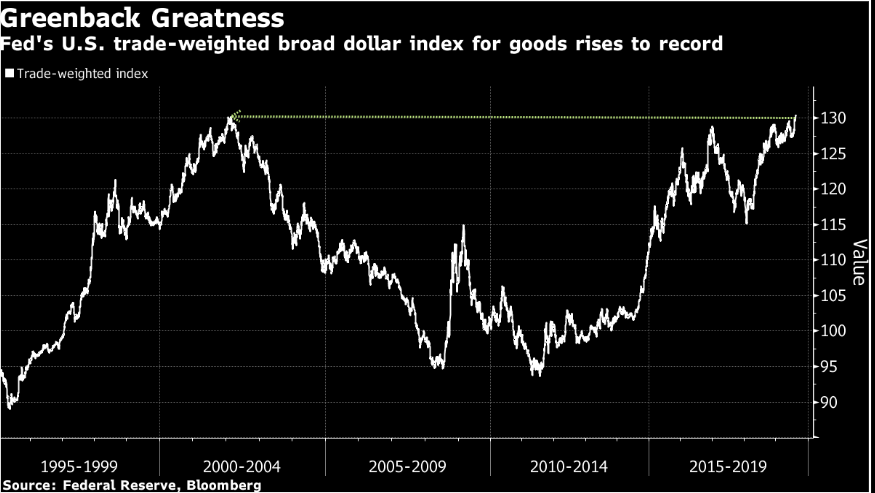
In FX we’ve seen the NOK as the outperformer in G10. That shouldn’t surprise given the upbeat in equity markets and solid moves in Brent crude. The CAD has been the weaker link; naturally, NOKCAD has been the big mover in G10 FX, with a rally off the lowest levels since 1985. The USD index closed up 0.2%, and trades at the top of its recent range, while much continues to be made of the trade-weighted USD that sits at an all-time high.
We saw a poor three-month US Treasury auction, while Fed member Eric Rosengren gave fairly hawkish commentary and has been partially attributed to the USD flow. US Treasuries were offered, and that’d have accelerated the USD move, with US two-year Treasuries closing +7bp, leading the twos-versus-tens curve to flatten 2bp to 5.4bp.
We also saw US 10-year real (i.e., inflation-adjusted) yields gaining 4bp, with implied volatility in the S&P 500 and 30-year Treasury futures moving lower. So, one could think we’re seeing carry buyers. But if traders are looking for carry, then the bid has been confined to the USD, as we’ve seen weakness in the BRL, TRY and MXN even against the JPY.
"Source: Bloomberg"
The Fed funds future is now pricing a 17% chance of a 50bp cut in the September FOMC meeting, which has been an easy trade for rates traders as argued of late. A cut of 50bp is just so unlikely. Fed Chair Jerome Powell should cement these expectations in the upcoming Jackson Hole symposium, although the fact that he’s called for radio silence from his Fed staff ahead of this conference suggests Powell could be gearing up for something punchy.
EURUSD sits below the 1.11 and, despite being hugely underloved, is eyeing a test of the 1 Aug pivot of 1.1027. While all the talk is about fiscal stimulus in Germany, the near-term driver remains the 12 Sept European Central Bank meeting and the idea that the swaps market is pricing in a 55% chance of the deposit rate cut to -60bp. How would the EU banking sector react to this cut even if it’s well telegraphed by markets? USDCNH has rallied 0.4% on the day. All eyes — as always — are on the CNY fix at 11:15 AEST, and whether the People’s Bank of China raises the midpoint by less than the streets models.
AUDUSD sits just off session lows of 0.6762, with focus on the Reserve Bank of Australia minutes at 11:30 AEST. With a 16.7% chance of a September rate cut, we aren’t expecting these minutes to be a volatility event. AUDUSD overnight IV sits at 7.26%, which, to put this into context, is the 20 percentile.
The material provided here has not been prepared in accordance with legal requirements designed to promote the independence of investment research and as such is considered to be a marketing communication. Whilst it is not subject to any prohibition on dealing ahead of the dissemination of investment research we will not seek to take any advantage before providing it to our clients.
Pepperstone doesn’t represent that the material provided here is accurate, current or complete, and therefore shouldn’t be relied upon as such. The information, whether from a third party or not, isn’t to be considered as a recommendation; or an offer to buy or sell; or the solicitation of an offer to buy or sell any security, financial product or instrument; or to participate in any particular trading strategy. It does not take into account readers’ financial situation or investment objectives. We advise any readers of this content to seek their own advice. Without the approval of Pepperstone, reproduction or redistribution of this information isn’t permitted.