- English
- 中文版
Daily Fix: Crazy times in bond land — ‘buy everything’ part two
It’s a subject I touched on yesterday, but liquidity and the projected path of central-bank easing are pushing capital ever further out the curve in a hunt for returns and risk.
For those who didn’t see this yesterday, it feels like this chart remains central to the markets’ thought process:
- Pink line – global money supply
- Red line – G3 central banks’ balance sheet and expected future trajectory
- White line – MSCI world index
- Orange line – Federal Reserve fund rate and future trajectory (as priced by rates pricing)
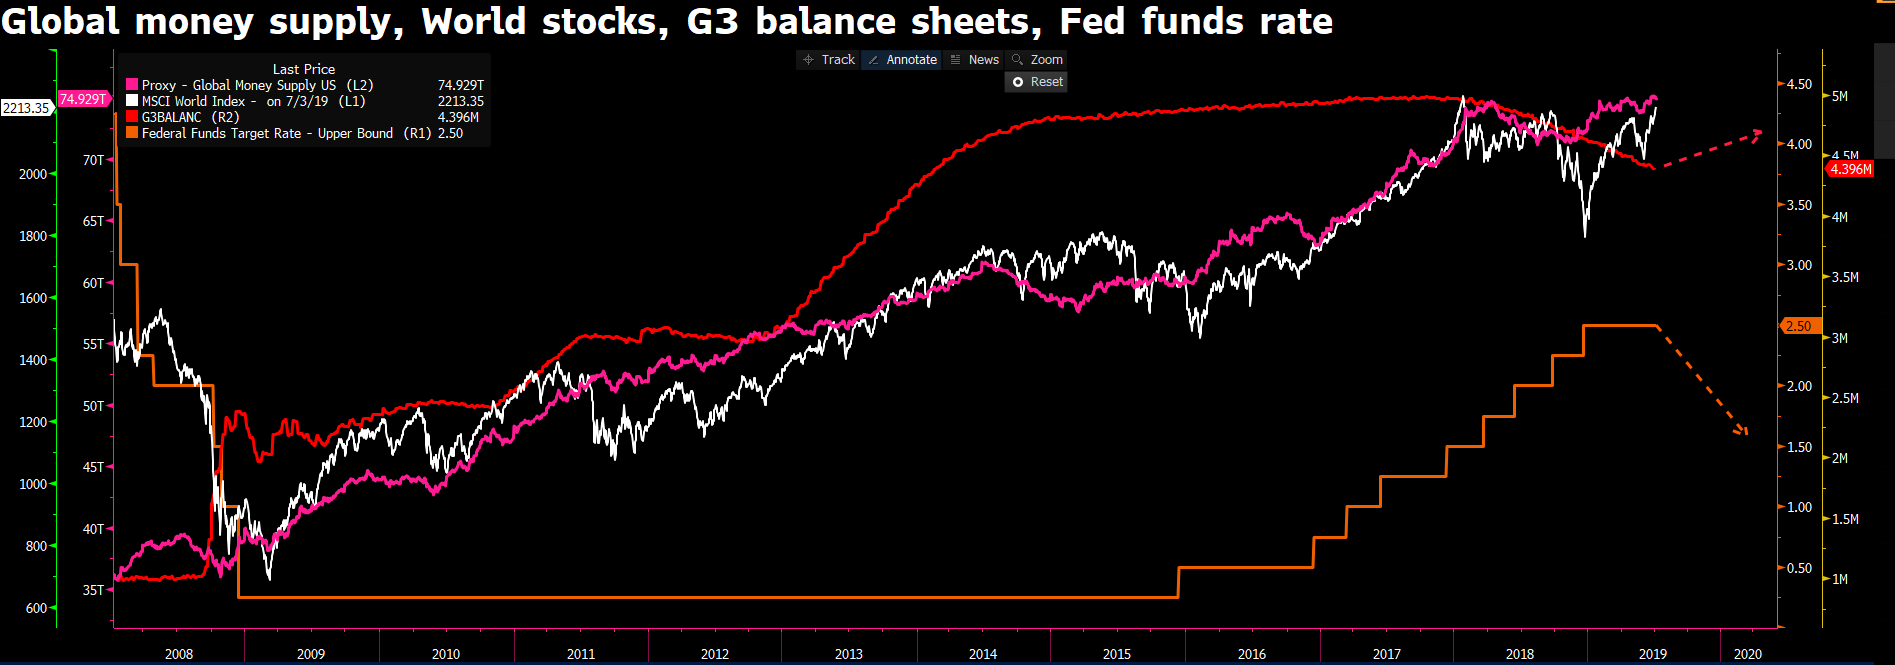
"Source: Bloomberg"
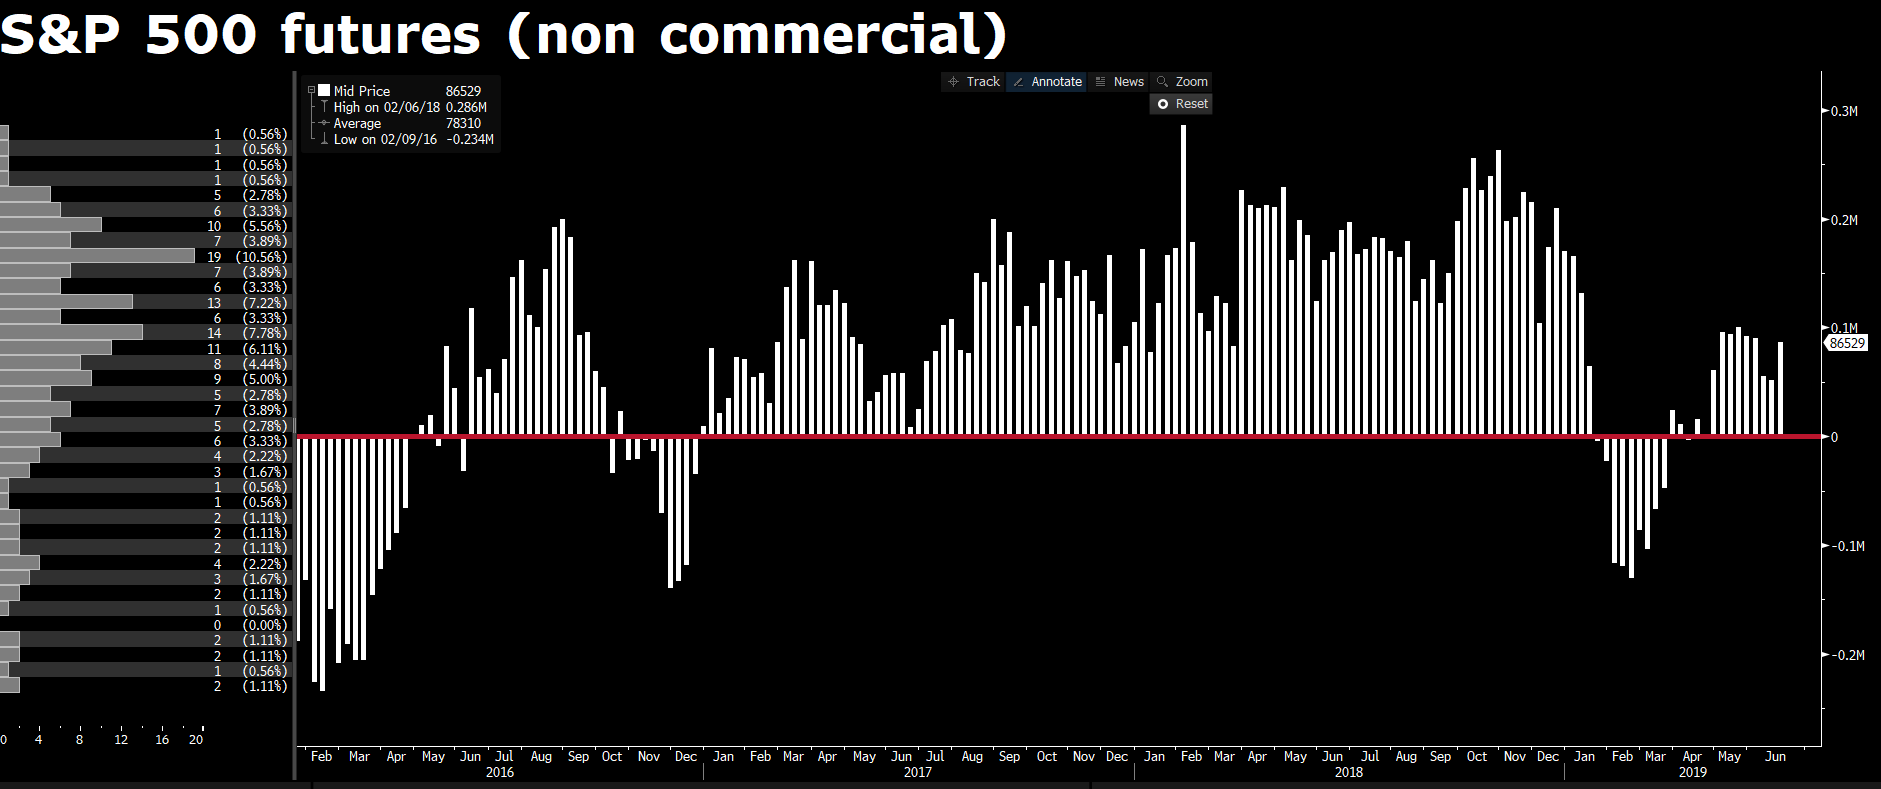
It’s the equity trade that’s caught everyone’s attention, though, as the trend seen so clearly in so many charts are a thing of beauty. The “buy everything” mantra rolls on in earnest. How can we be short of equities with any conviction when the weight of capital is only going one way? Also, whether I look at market internals or positioning, there are no signs of euphoric conditions. Take the weekly Commitment of Traders report. Here, we see CFTC data showing net long positions (non-commercials accounts) of S&P 500 futures at 86,000 contracts. Even at these levels, we can see it’s certainly not stretched by any means.
We have the S&P 500 making its third consecutive record high and yet only 8.5% of companies have a 14-day RSI above 70, with a mere 14% of the index closing at a 4-week high. I can look at the percentage of companies above their 50- and 200-day MA and see these sit at 76% and 73% respectively. Not at levels where the hypothetical elastic band has been pulled too far.
The fixed income juggernaut
But we have to look at the global bond market to understand why equities and high-yield credit are grinding ever higher.
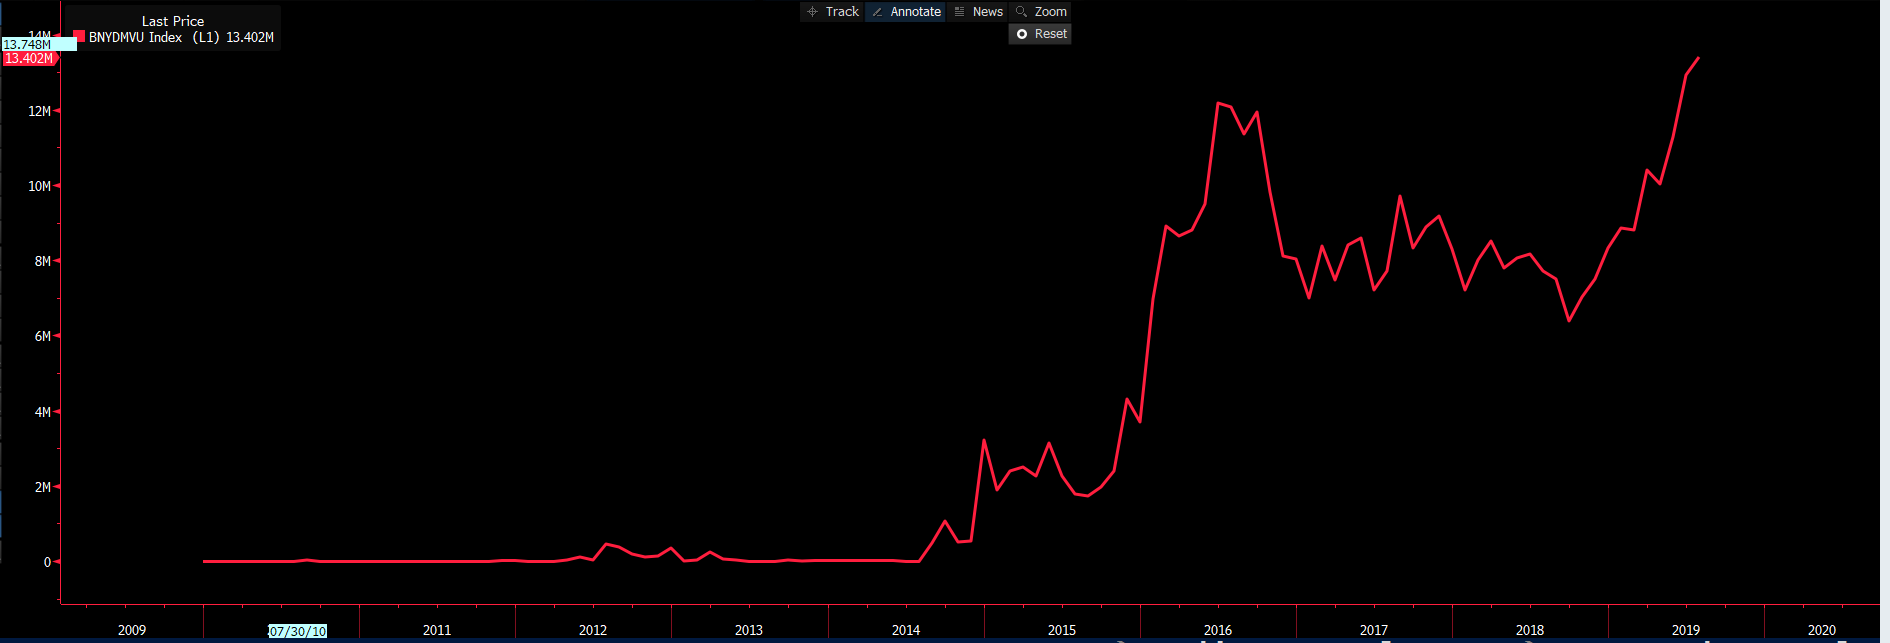
There’s so much chatter about the pool (USD value) of bonds that command a negative yield. To put this into context, if the corresponding government were to issue bonds at these levels, they’d effectively be paid by investors to do so. It’s like the principle of me going to ANZ and borrowing A$1mil to buy a house, and ANZ paying me to borrow. Mad times, indeed. If you feel yields will go further into negative territory (price higher) and you can make a capital return, there are no issues with buying a negative bond as a trade. Well, as you can see, this pool has reached record levels at US$13.4tril.
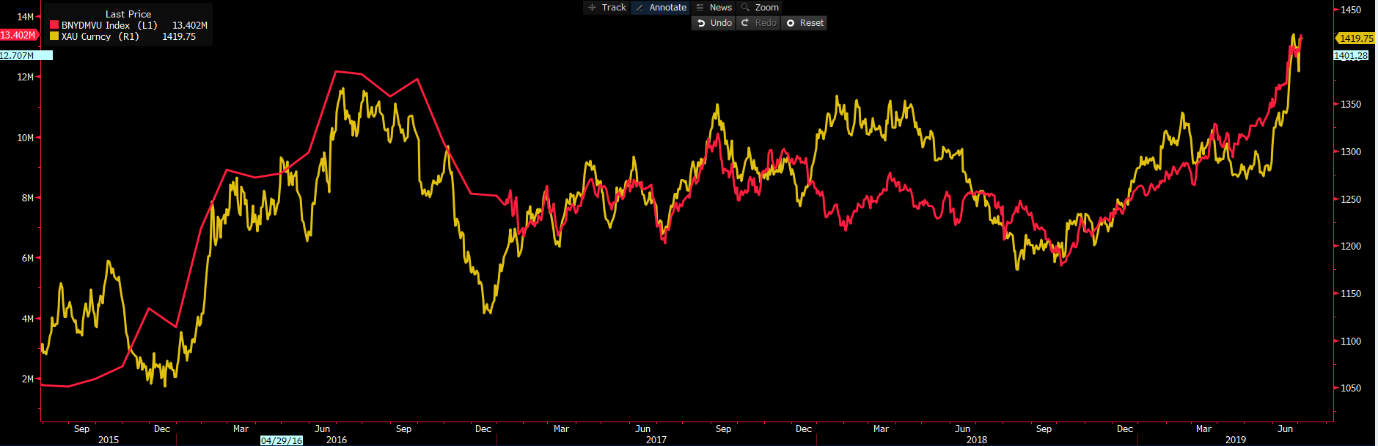
See how the pool of negative-yielding debt is impacting the gold price (yellow line). I’d add Bitcoin here, too, as they’re moving together but just at a different pace. Gold is a store of value when nominal yields are going ever lower.
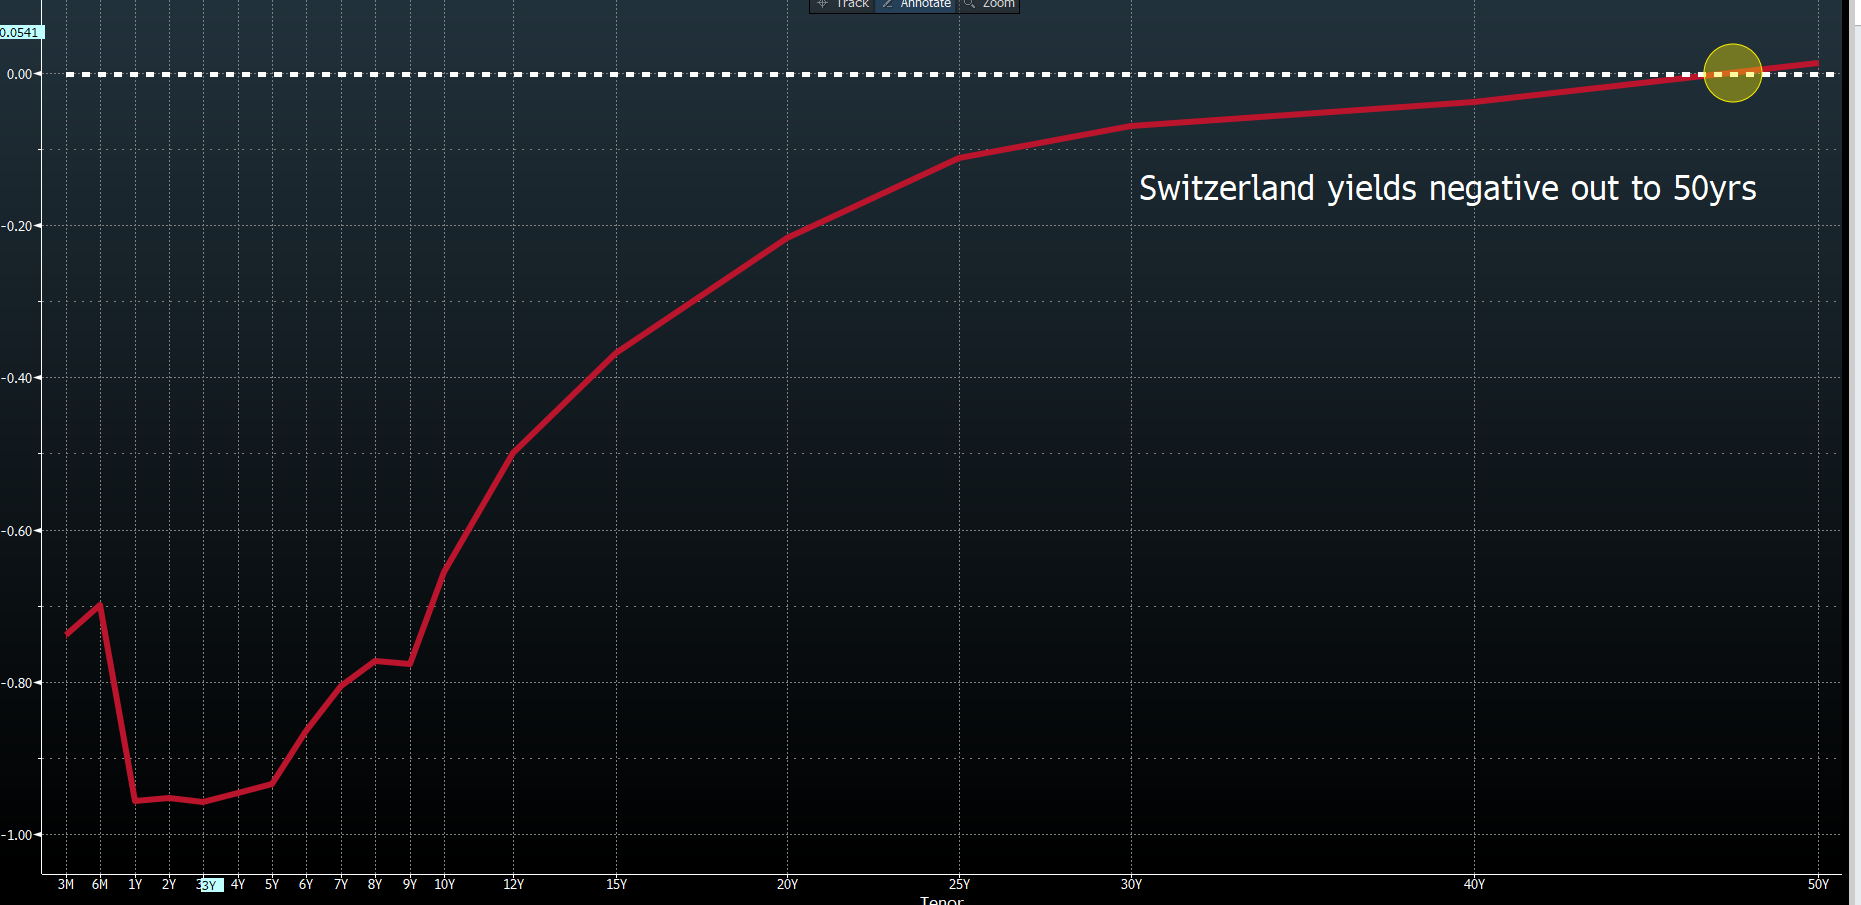
When it comes to negative-yielding debt, though, Switzerland takes the top prize. This chart has garnered some attention of late, with Swiss government bond yields negative out to 50 years. The white dotted line is the zero-yield level — mad times.
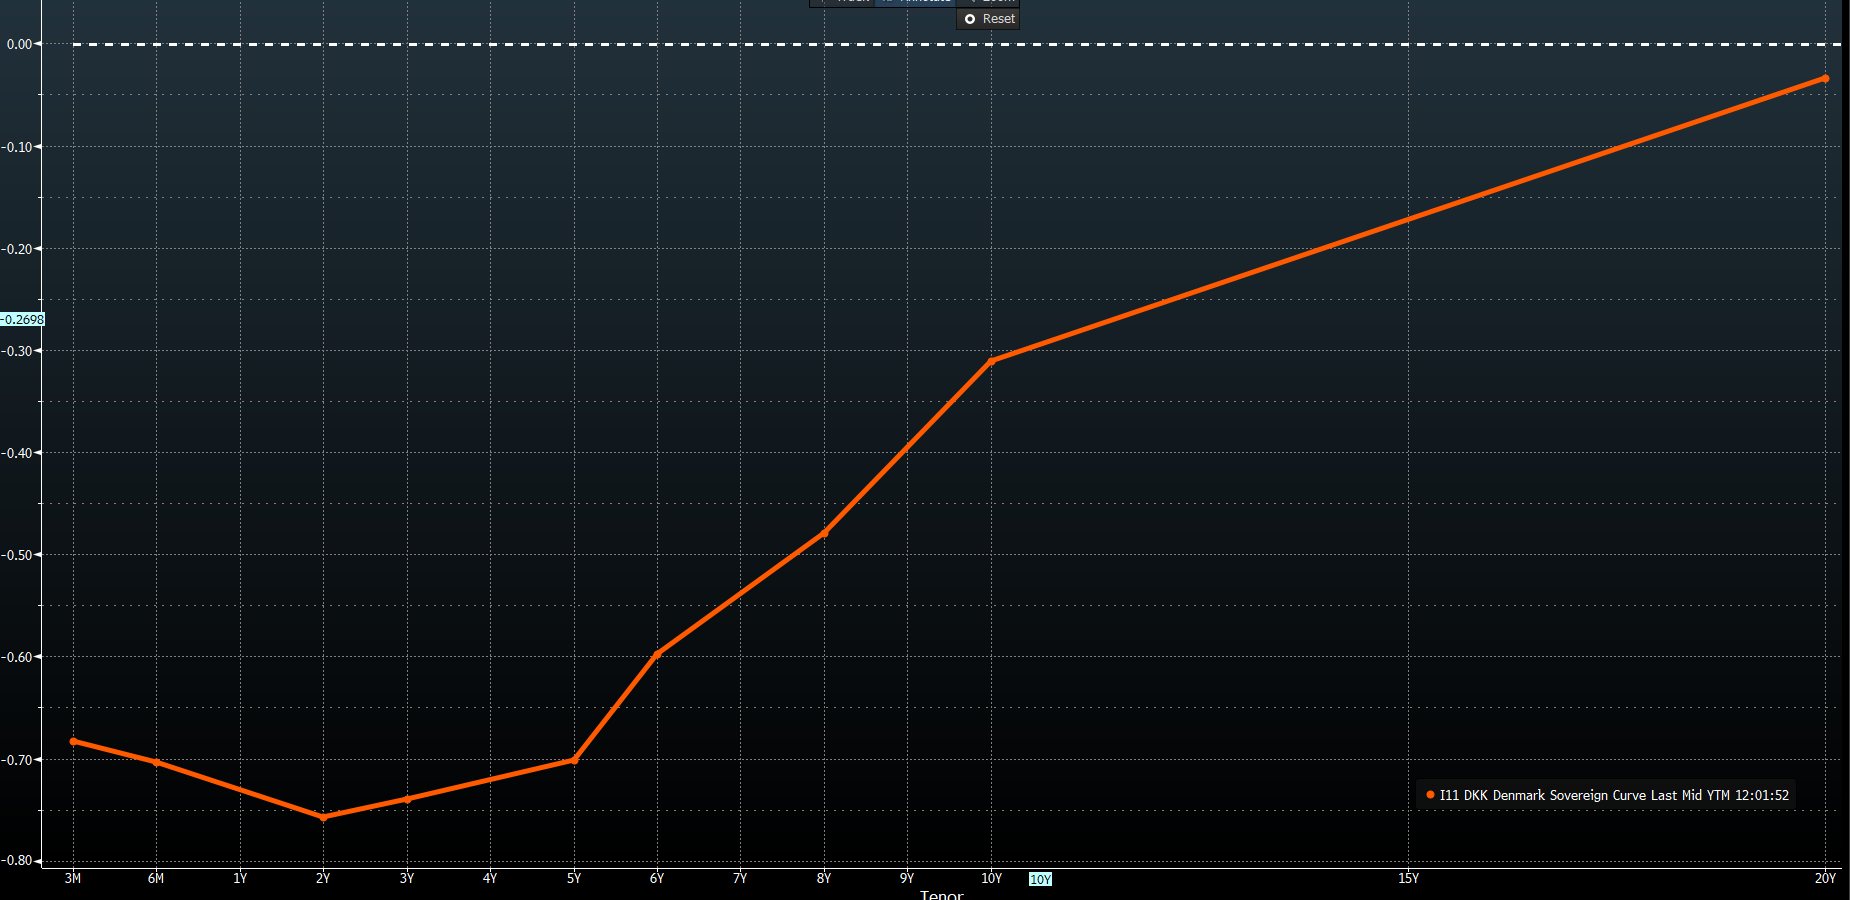
Denmark has issued debt out to 20 years’ maturity, and every part of the curve is now negative.
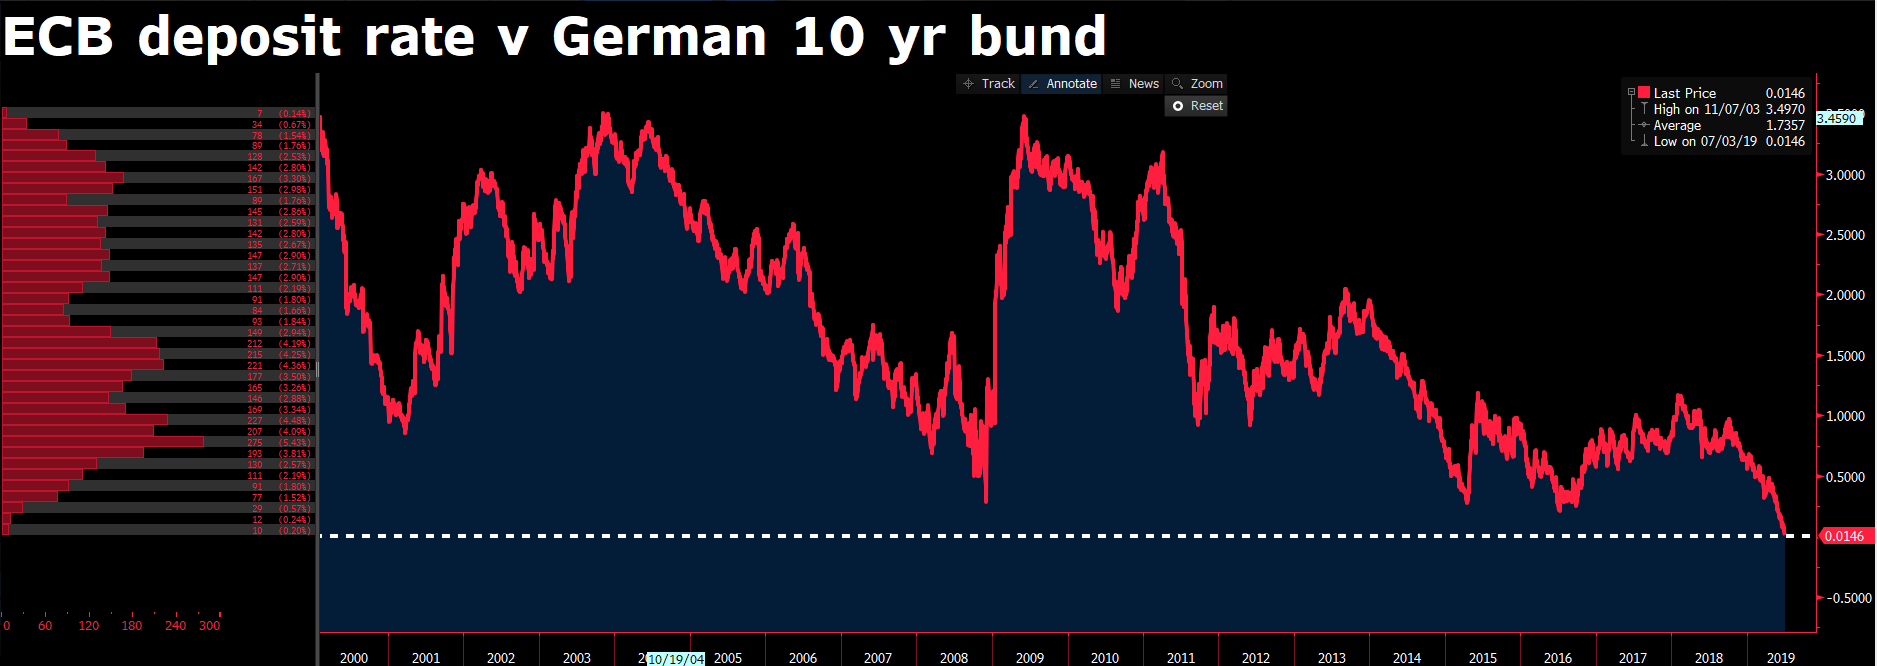
In Germany, the benchmark 10-year bund is about to trade with a yield lower than the European Central Bank’s deposit rate. The deposit rate is the rate the ECB charges financial institutions to park excess capital on their balance sheet effectively risk-free. The idea being, if you charge these institutions, they’ll be loath to hold capital on the ECB’s balance sheet, and will either feed this into the financial markets (asset price inflation) in search of a return or, better yet, use the capital to lend into the real economy and actually try and make a profit.
Granted, we’ve seen a better feel to various EU labour market indicators. But create inflation and growth, a -40bp charge on banks excess reserves, it hasn’t.
It’s been a headwind for the EUR, though. It’s aided the perception that capital may be headed offshore, and reinforced the idea that if you want carry in FX, then using the EUR is a good idea.
Certainly, the bearish moves in EURCAD, EURNZD and EURAUD may extend further in the short term, especially if implied volatility continues to be suppressed.
What changes this script?
Well, potentially Friday’s US non-farm payrolls could cause a sell-off in bonds. But we’d need to see a huge number and far in excess of the consensus of 160,000 jobs — and potentially even a sizeable revision to last month’s poor 75,000 read, as well as hourly wages into 3.4% or above. This is, however, a world looking to buy any pullbacks in bonds, and funds have been pushed further out the curve in a bid for yield and returns.
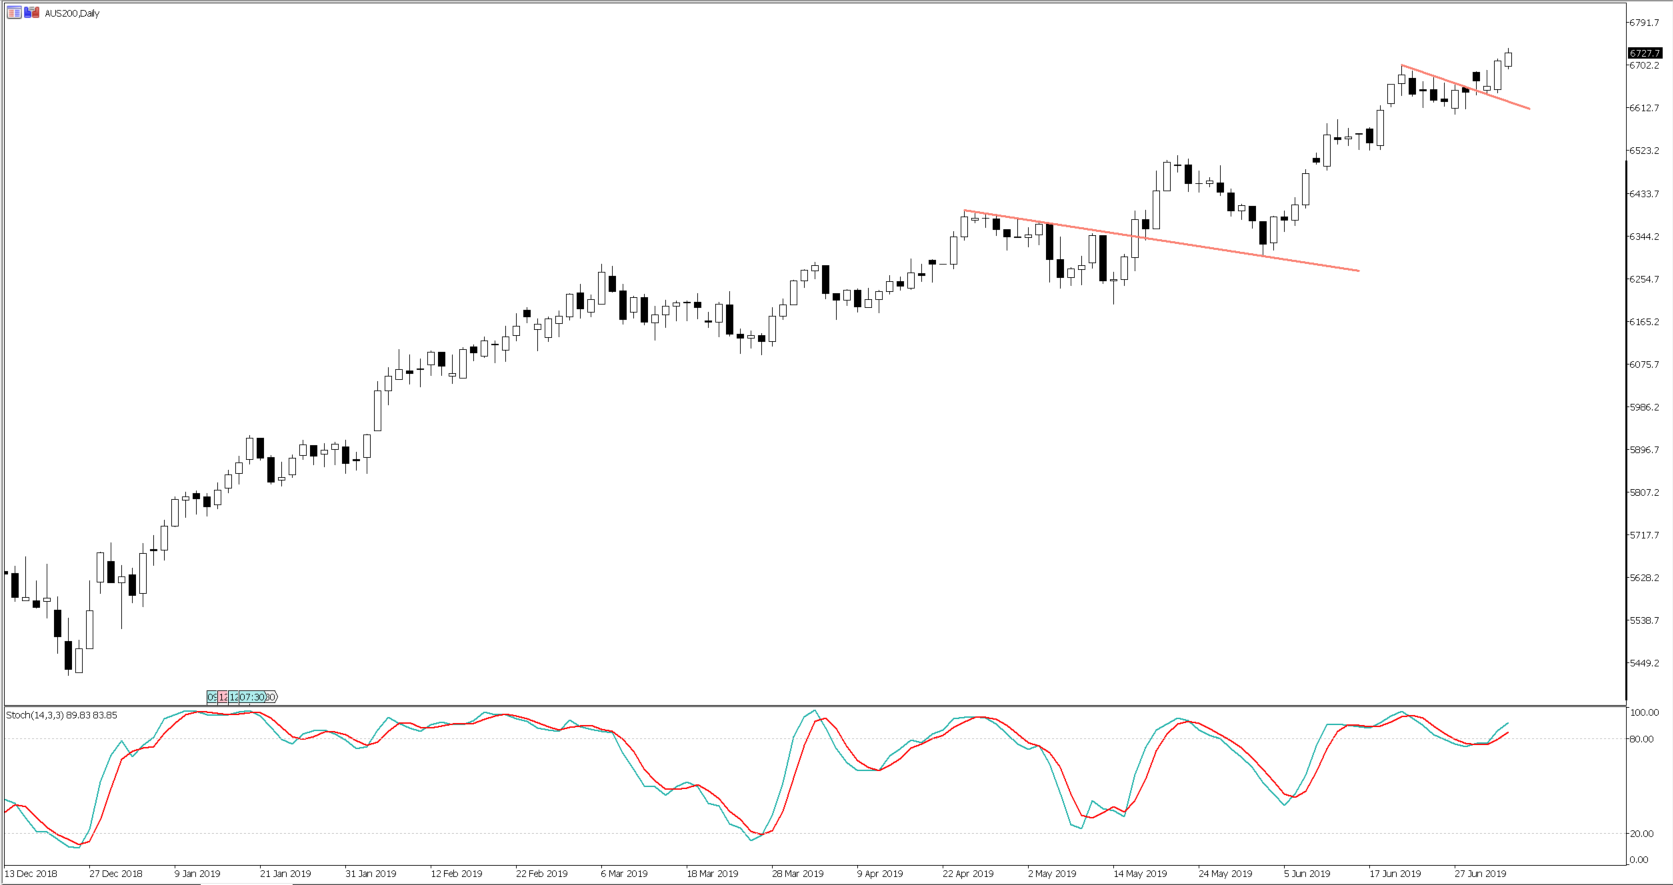
"ASX 200 daily chart"
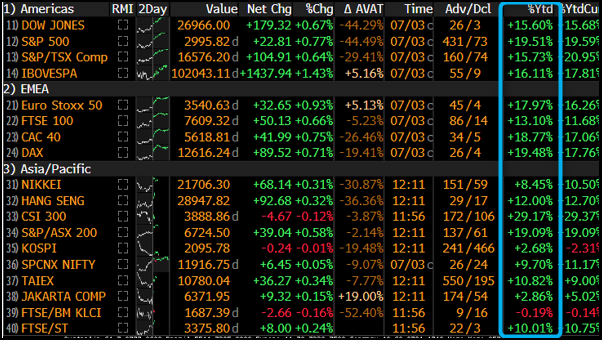
As long as yields are going down, and the market holds confidence in its projections for deeper interest-rate cuts, then equities will likely grind higher. So, we have all-time highs in the S&P 500, Dow and Nasdaq 100, as well as bullish breakouts in the ASX 200, FTSE 100, CAC 40 and DAX. Lower bond yields reinforce the earnings yields in the equity market. It makes the projected future cash flows more compelling, boosting net present value (NPV), and lowers the equity risk premia.
The most significant risk to this trend has to be a market that loses faith that the price-maker central banks won’t act as aggressively as expected — and / or economics deteriorate to the point where we lose confidence central-bank actions will even work. We’re some way from this point yet, but it gives me faith gold is a long-term buy.
The blue highlighted area shows the year-to-date returns. If you’d told me that we’d be up 19% by July, I’d have questioned your logic. Mad times. But this is the liquidity-driven dynamic we live in.
The material provided here has not been prepared in accordance with legal requirements designed to promote the independence of investment research and as such is considered to be a marketing communication. Whilst it is not subject to any prohibition on dealing ahead of the dissemination of investment research we will not seek to take any advantage before providing it to our clients.
Pepperstone doesn’t represent that the material provided here is accurate, current or complete, and therefore shouldn’t be relied upon as such. The information, whether from a third party or not, isn’t to be considered as a recommendation; or an offer to buy or sell; or the solicitation of an offer to buy or sell any security, financial product or instrument; or to participate in any particular trading strategy. It does not take into account readers’ financial situation or investment objectives. We advise any readers of this content to seek their own advice. Without the approval of Pepperstone, reproduction or redistribution of this information isn’t permitted.