- English
- 中文版

Within this backdrop, the equity juggernaut headed ever higher, while FX traders looked to be paid to be in positions, piling into carry trades, and seeing attractions in currencies such as the MXN and the USD.
There was a general belief that very little could derail this thematic - The coronavirus changed that, with concerns that supply chain disruptions, quarantining the public (in certain countries) and border closures will lead to lower global growth and a further deterioration in globalisation. In a market full of confidence and suddenly having to ask questions as to the extent of the economic fallout. Not to mention how to effectively price risk, market participants received few clear answers – this lack of clarity and uncertainty has caused ripples through financial markets.
Volatility comes alive, where on Monday we saw
- The Dow dropped 1031 points – the third biggest points fall ever recorded
- The S&P500 (US500) closed 3.4% lower – the biggest decline since February 2018
- The Italian MIB fell 5.4% - the largest fall since 24 June 2016 (-12.5%) and a 5 Z-score move
- S&P500 implied volatility (VIX index) rallied above 20% and the highest since January 2019 – traders expect further big moves in the S&P500
- Brent crude drops 3.8%, causing ripples in petro-currencies like the NOK and CAD
- Airline stocks, predictably, were smashed
- US 5-year Treasury fell a sizeable 12bp, with the 10-year Treasury (closing at 1.36%) eyeing a record low of 1.31%
- Interest rate markets moved to price a 58% chance of a cut from the Fed in April (from 34%), with two rate cuts expected by December
- Gold trades to $1689 – the highest since February 2013
- The JPY re-establishes itself as the go-to safe-haven currency, rallying strongly against all major currencies
The why?
- Don’t dismiss the fact Bernie Sanders won Nevada caucus and is the clear favourite for the Democrat nominee
- Politics aside, the broad concern is we are seeing a pandemic leading to further supply chain disruptions and adding further worries of to ever-deteriorating global economy – can central banks save us this time around?
- South Korea raises virus level to “red” – forceful and strong measures to contain a further spread are now expected
- South Korea consumer confidence falls the most in five years – the start of thing to come?
- Concerns push outside of China - 30 countries outside of China have now seen cases of the virus, with fears mounting about an outbreak in the Middle East and Italy and the possibility of a threat to Germany
- Italy lockdown 50,000 people near the financial hub of Milan and close schools – what’s next?
- Austria are ready to implement border closures
- The direct impact on the corporate landscape is becoming clear - Apple detail they will miss Q2 sales guidance. United Airlines withdraws 2020 forecasts. Mastercard lowers revenue growth
Key charts to define
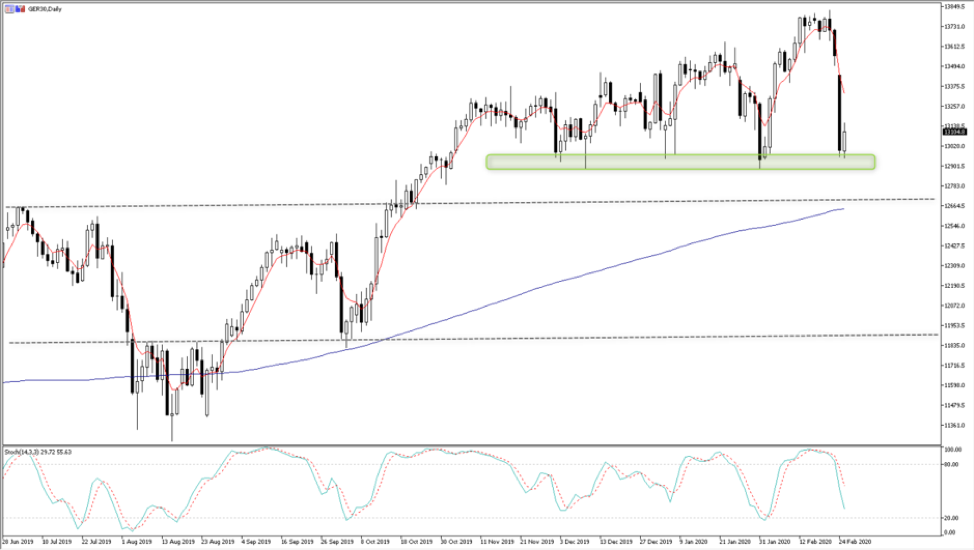
GER30 – The German Dax (GER30) is somewhat less volatile than the ITA40 but is always a client favourite. The defence of 13000 to 12,900 (green shaded area) is undeniable and we're seeing that play out again today in Asia, thanks largely to Trump who has tweeted that the “stock market is looking very good to me”. S&P 500 futures sit up 0.7% at this stage and DAX bulls are defending this horizontal support. That said, 12,900 is the Maginot line and if this gives way then volatility in equities goes higher and the index should fall to 12660 and then 11860.
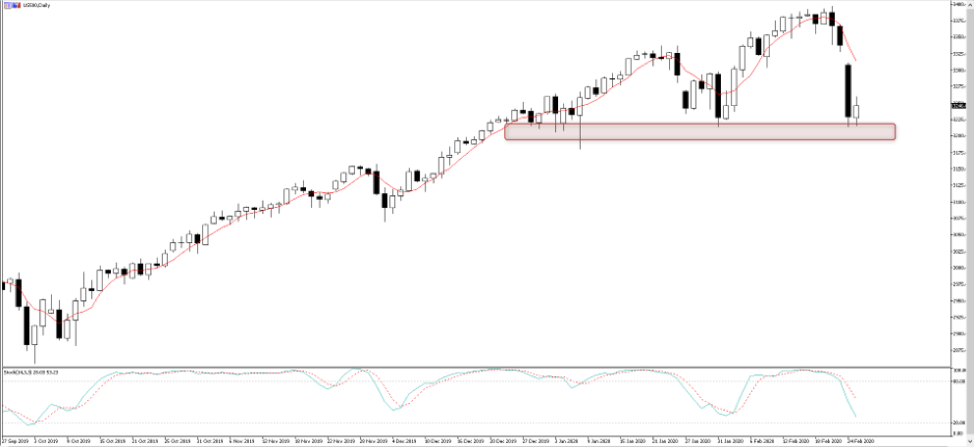
US500 – Similar to the GER30, the bulls are putting up a fight in this US index into 3214/12. They will want to see another snapback with price gravitating towards 3311, for a test of the 3328 gap over time. That said if 3214 gives way then expect even higher volatility and uncertainty to hit markets with a potential drawdown into 3070. One would expect gold, the JPY and the VIX index to increase should the index break 3212, so it should be on every traders radar.
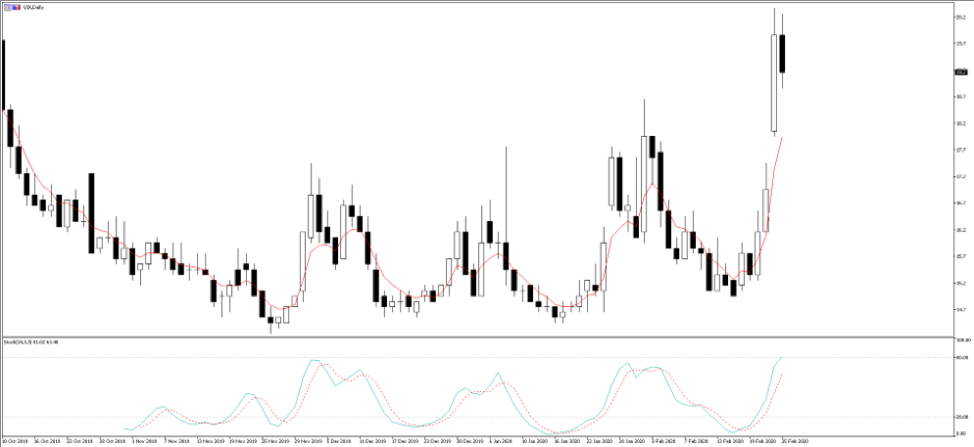
US volatility index (VIX index) – For those who have not seen, Pepperstone are now offering the VIX index as a tradeable market. The VIX index is a measure of the implied volatility of the S&P 500 over the coming 30-days and is a great tool to visualise and express a view on the expected movement in the S&P 500. The higher the VIX, the greater the expected movement in the index. We can use this as a guide on concerns in the market.
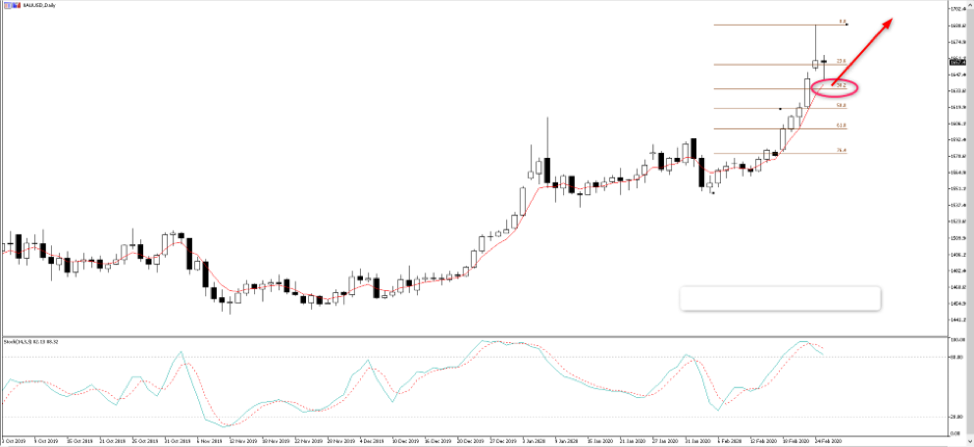
Gold (XAUUSD) – Gold has had a solid run since late November, rallying some $240 and gaining in all major currencies (not just USDs). See Chris Weston’s weekly gold video on our YouTube channel, or sign up for his Daily Fix, for more in-depth colour on the catalysts of gold moves. However, gold remains a natural hedge against the economic fallout from the coronavirus and the risk of a Bernie Sanders Presidential election victory. There is a lot of love for the yellow metal at current levels, but pullbacks remain a buying opportunity.
The circuit breaker
As always when we see volatility ramp up, we look for a circuit breaker and a response to calm market nerves. While these are high level, the clear circuit breakers we see are:
- Central banks – Interest rate cut expectations have increased and it’s a coin toss if the Fed cut in April. If we see the S&P 500 break 3214 then expect the market to express disappointment if the Fed doesn’t move in alignment to market pricing.
- Fiscal stimulus – Trump will not want a falling equity market into the US election and will say all the right things to prop up the markets. This may include a punchy stimulus. We are already hearing signs that Germany and other EU nations may follow suit. Expect Korea and Japan to also offer fiscal stimulus – will this be enough to please the market if economics are truly threatened?
- Virus statistics - Perhaps the most obvious circuit breaker would be signs that the virus is contained in China and the fears of an outbreak in Europe and wider Asia are overblown
Economic data - If the economic data due in the next two weeks, specifically that of China’s data flow, proves to be less bad than feared. Watch this Saturday’s China manufacturing and services PMI as key event risks, where a sizeable slowdown is expected. Will it be as bad as feared?
Ready to trade?
It's quick and easy to get started. Apply in minutes with our simple application process.
The material provided here has not been prepared in accordance with legal requirements designed to promote the independence of investment research and as such is considered to be a marketing communication. Whilst it is not subject to any prohibition on dealing ahead of the dissemination of investment research we will not seek to take any advantage before providing it to our clients.
Pepperstone doesn’t represent that the material provided here is accurate, current or complete, and therefore shouldn’t be relied upon as such. The information, whether from a third party or not, isn’t to be considered as a recommendation; or an offer to buy or sell; or the solicitation of an offer to buy or sell any security, financial product or instrument; or to participate in any particular trading strategy. It does not take into account readers’ financial situation or investment objectives. We advise any readers of this content to seek their own advice. Without the approval of Pepperstone, reproduction or redistribution of this information isn’t permitted.