- English
- 中文版

It’s like the Coronavirus matters little to markets and despite a deep worry from a humanitarian perspective, the markets march on, with implied vol pulling back, heading to similar conditions seen a few weeks ago.
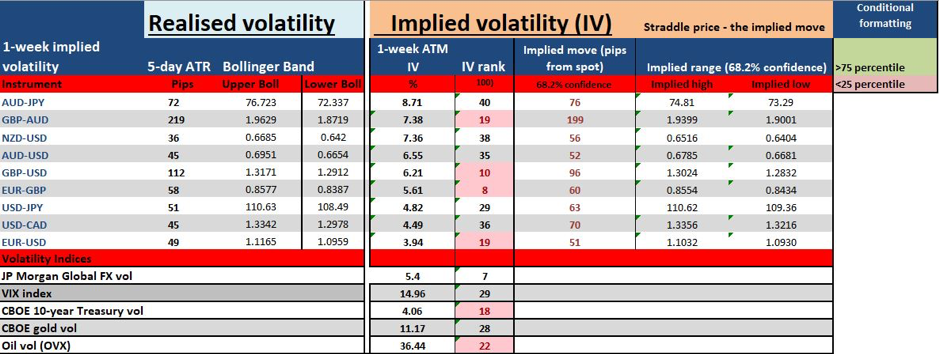
Weekly volatility matrix
The situation remains fluid though and there’s still part of me that feels the market has got ahead of itself, where sentiment could turn sour again quite easily. Still, this is a Teflon market, and nothing sticks for too long…we can thank central banks for that.
In the week ahead video, I focus on several indicators that measure sentiment, some which you may not be so familiar with, such as S&P500 1-month skew or AUDJPY 1-month – 1 year implied volatility spreads, and its relationship with spot AUDJPY. We touch on near-term event risk to concern ourselves with, and how markets are interpreting these risks in terms of expected volatility and price moves.
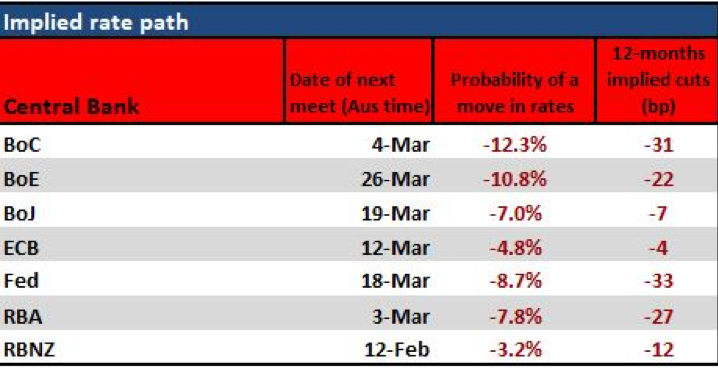
We also look at the markets expected interest rate pricing, where we see reduced expectations of more aggressive action. Where the upcoming meetings suddenly look to be fairly dull affairs and perhaps the most we can do is look for the triggers needed to see further rate cuts. This rates pricing has seen a reduction in volatility in markets and with this coming week being a quiet affair (for event risk), perhaps this emergence in risk appetite should continue.
Charts of interest
I also look at charts of interest, and specifically the USD index, EURUSD, AUDUSD, GBPUSD and USDCAD. USDJPY also looks interesting around 110.00. USDSGD is also on the radar, specifically given client interest in this pair has picked up, with price having moved 400-odd pips from the mid-January lows, one could remark that this is the SGD’s Tesla moment.
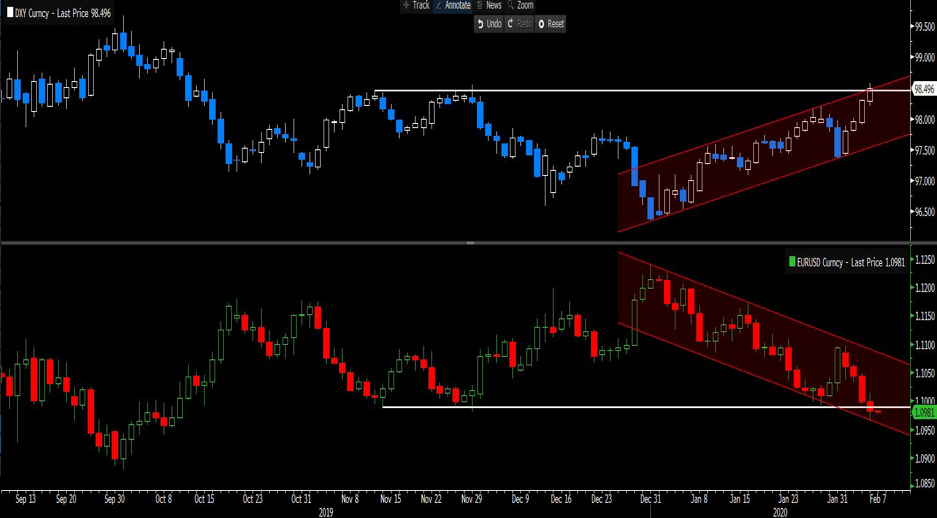
Top pane \u2013 USDX, lower \u2013 EURUSD
Ready to trade?
It's quick and easy to get started. Apply in minutes with our simple application process.
The material provided here has not been prepared in accordance with legal requirements designed to promote the independence of investment research and as such is considered to be a marketing communication. Whilst it is not subject to any prohibition on dealing ahead of the dissemination of investment research we will not seek to take any advantage before providing it to our clients.
Pepperstone doesn’t represent that the material provided here is accurate, current or complete, and therefore shouldn’t be relied upon as such. The information, whether from a third party or not, isn’t to be considered as a recommendation; or an offer to buy or sell; or the solicitation of an offer to buy or sell any security, financial product or instrument; or to participate in any particular trading strategy. It does not take into account readers’ financial situation or investment objectives. We advise any readers of this content to seek their own advice. Without the approval of Pepperstone, reproduction or redistribution of this information isn’t permitted.